 ORIONFOLD
All elementsFlow Elements / Chart and diagram kinds · 54 elements
Fifty-four ways to draw your numbers, and what each one needs
Fifty-four chart and diagram kinds, each with the data it takes. Switch kinds and keep your data, on your Mac, with no model involved.
Chart and diagram kinds · Comparison and ranking1 of 54
Bar chart
Compare a modest set of amounts on one shared unit.
Start at zero when length carries the comparison; use a horizontal orientation for long names.
Takes: a two-column table, one category column and one number column, with up to a dozen rows. Name one row in highlight and it takes the accent while the rest recede.
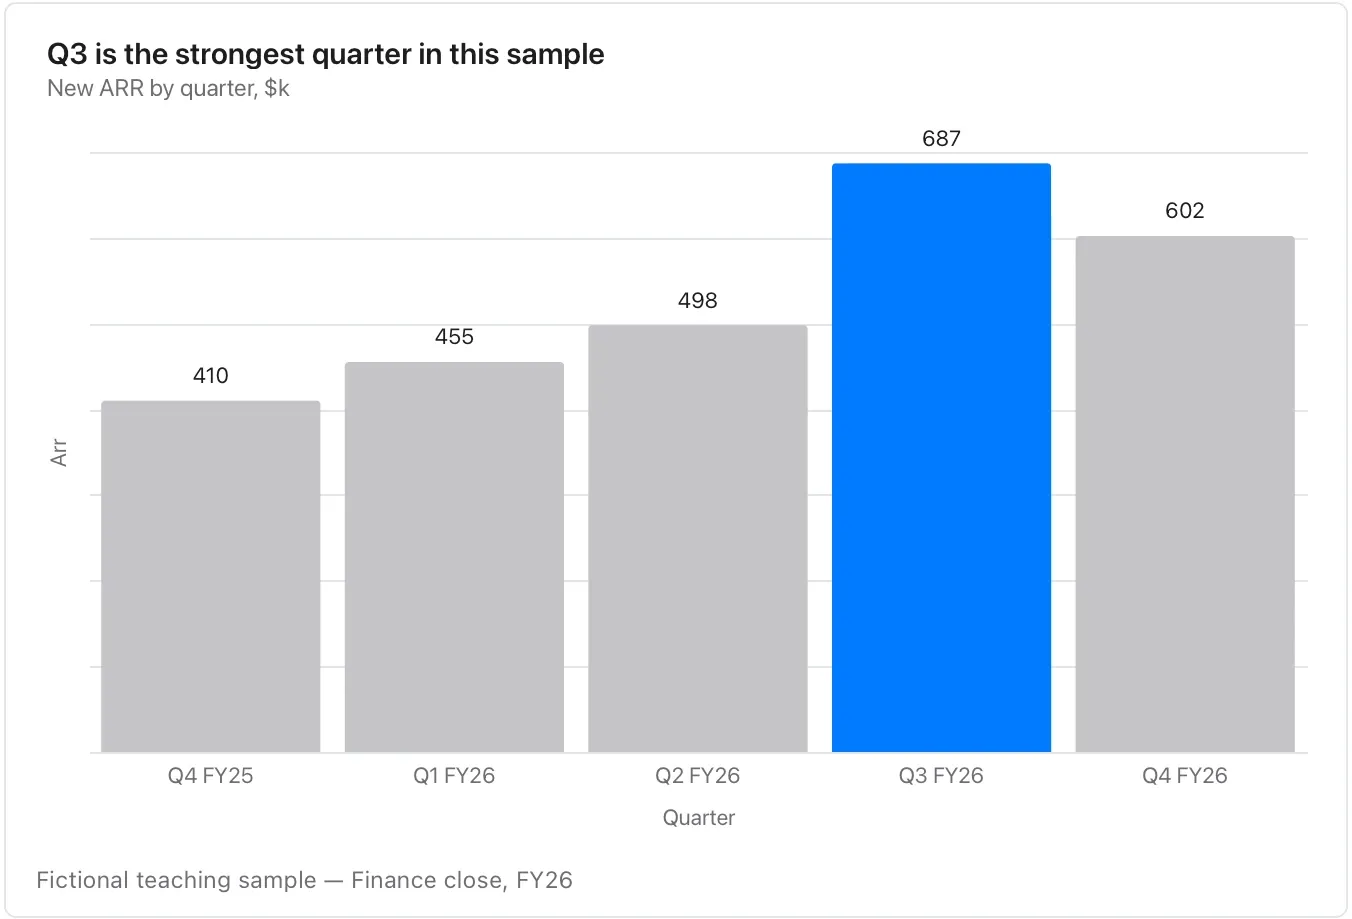
Chart and diagram kinds · Comparison and ranking2 of 54
Grouped bar chart
Compare the same categories under two or three conditions.
Keep units and group order consistent; many groups are easier to read in separate charts.
Takes: a table with a category column, a group column and a value column. That means the same categories measured under two or three conditions, such as regions across years.
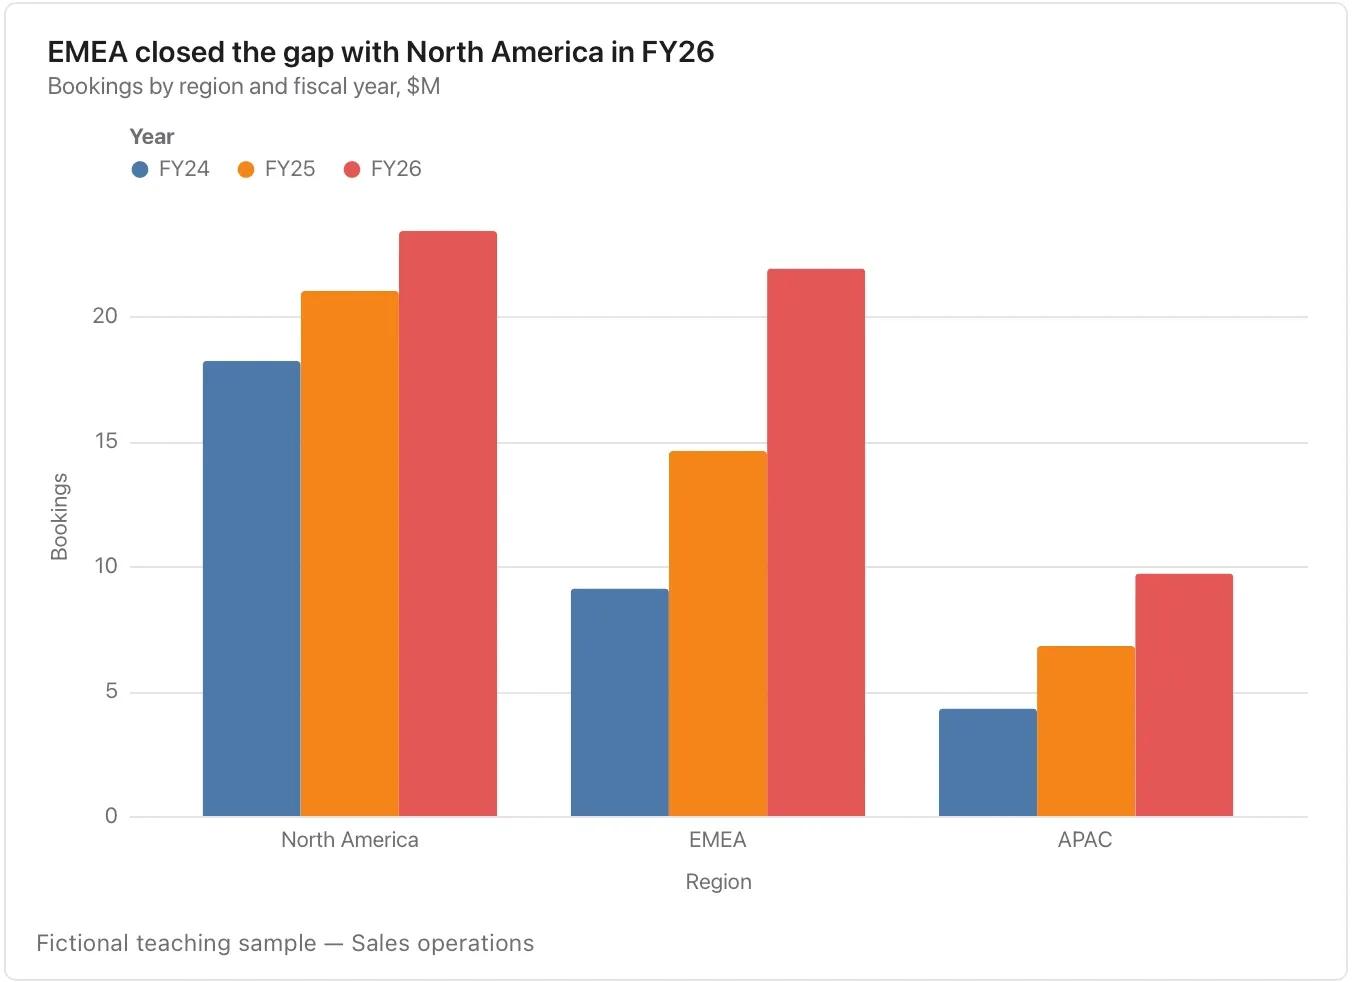
Chart and diagram kinds · Comparison and ranking3 of 54
Stacked bar chart
Compare totals and their components together.
Only the first component has a common baseline, so use grouped bars when precise middle-component comparisons matter.
Takes: a table with a category column, a part column and a value column, where the parts of each category add up to a meaningful whole, such as cost by team and category or headcount by office and function.
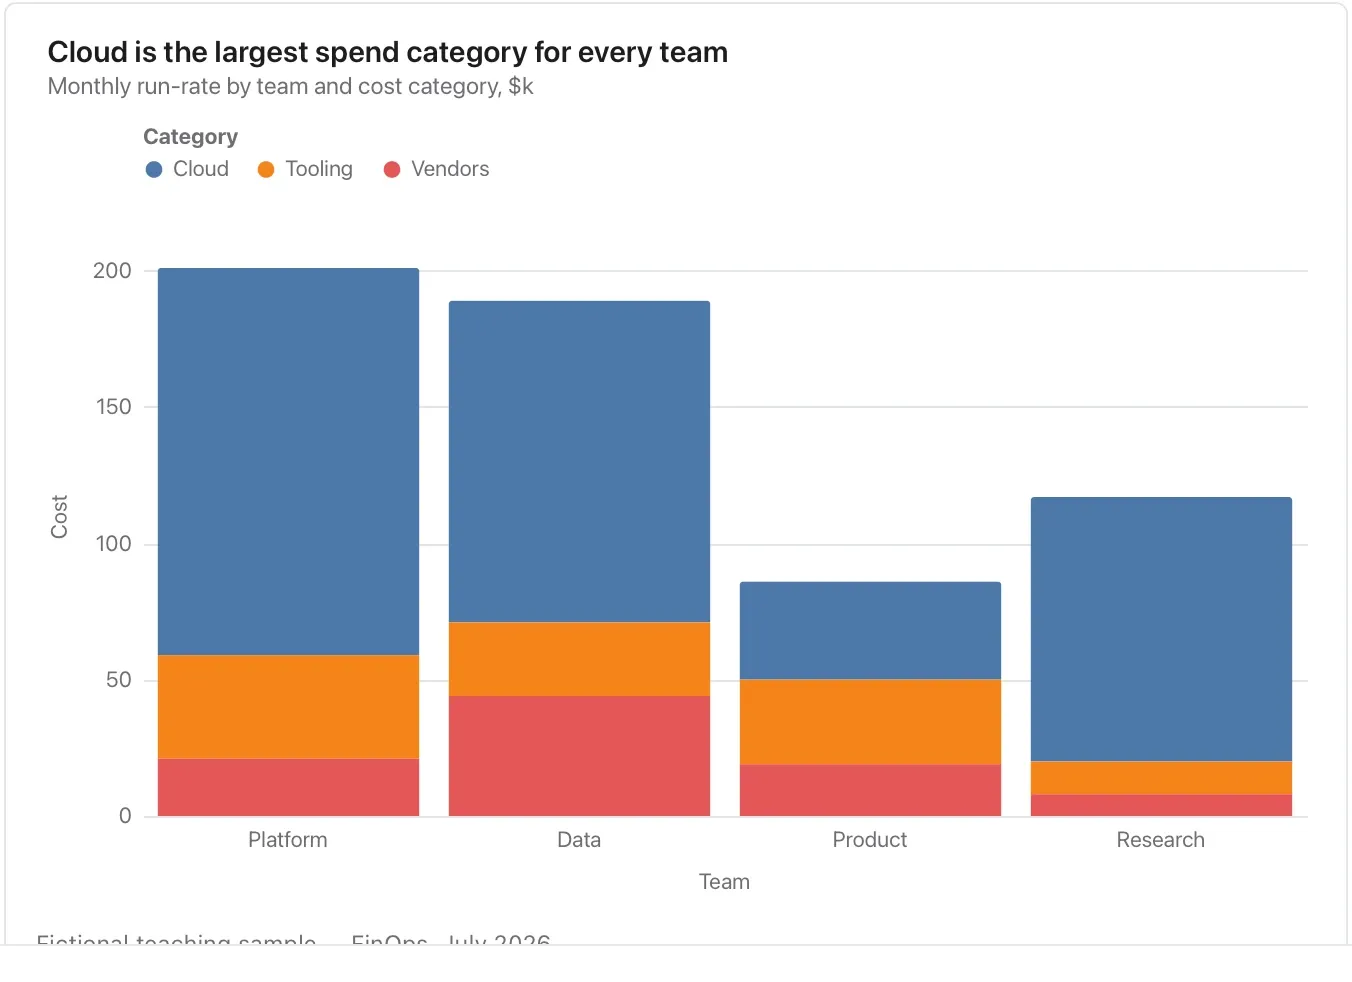
Chart and diagram kinds · Comparison and ranking4 of 54
Lollipop chart
Keep a longer category list light while preserving individual amounts.
Order the rows intentionally; a decorative stem is not a confidence interval.
Takes: the same two-column table as a bar chart, but with many rows or long labels. The thin stem keeps a ranked list of twenty items legible.
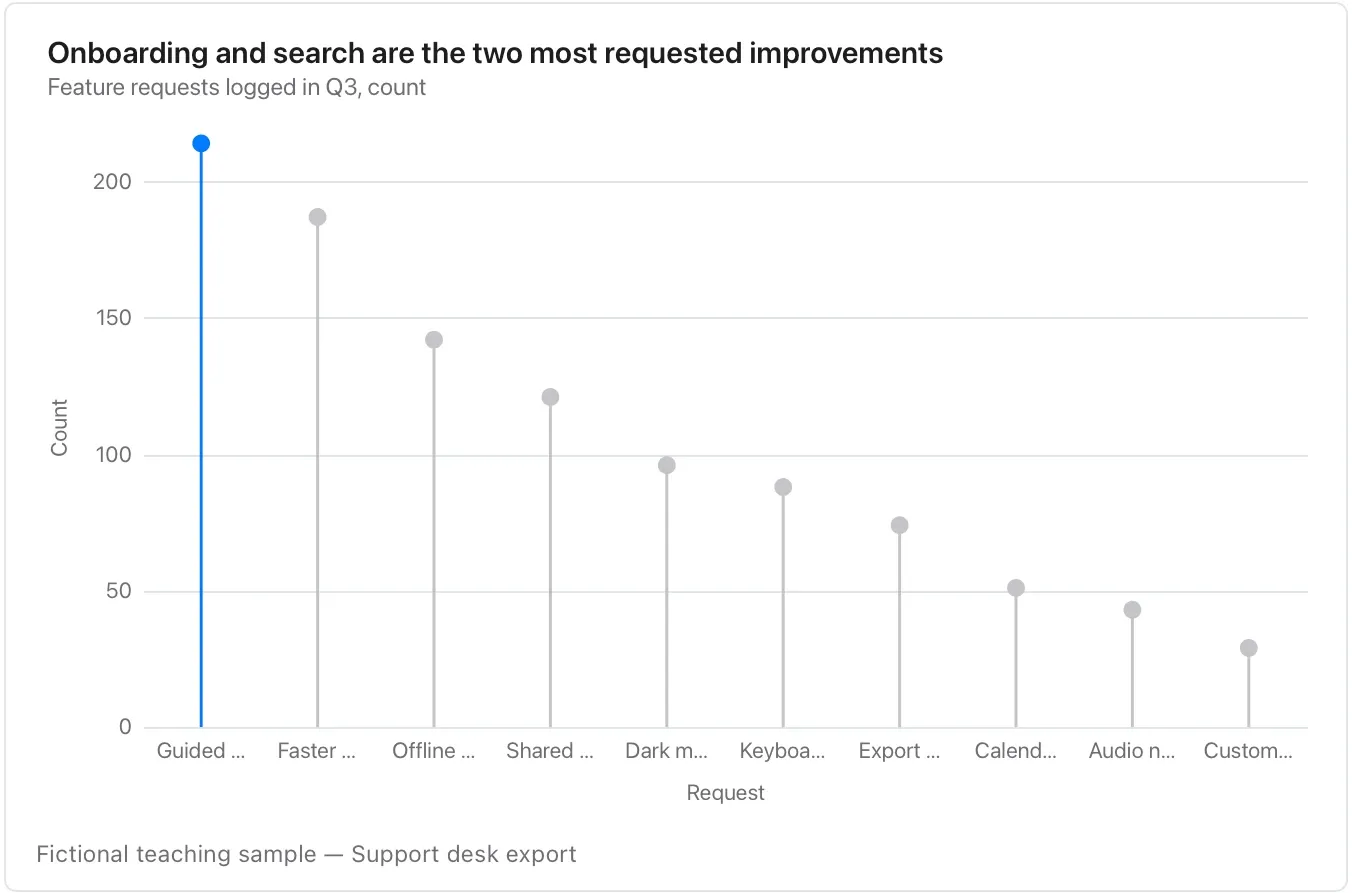
Chart and diagram kinds · Comparison and ranking5 of 54
Bar table
Read exact values alongside their relative size.
Show the measurement basis; a score without its rubric is not a recommendation.
Takes: a ranked table of names and one number, when you want the numbers read as a list as well as compared. That fits a leaderboard, a vendor shortlist or a benchmark.
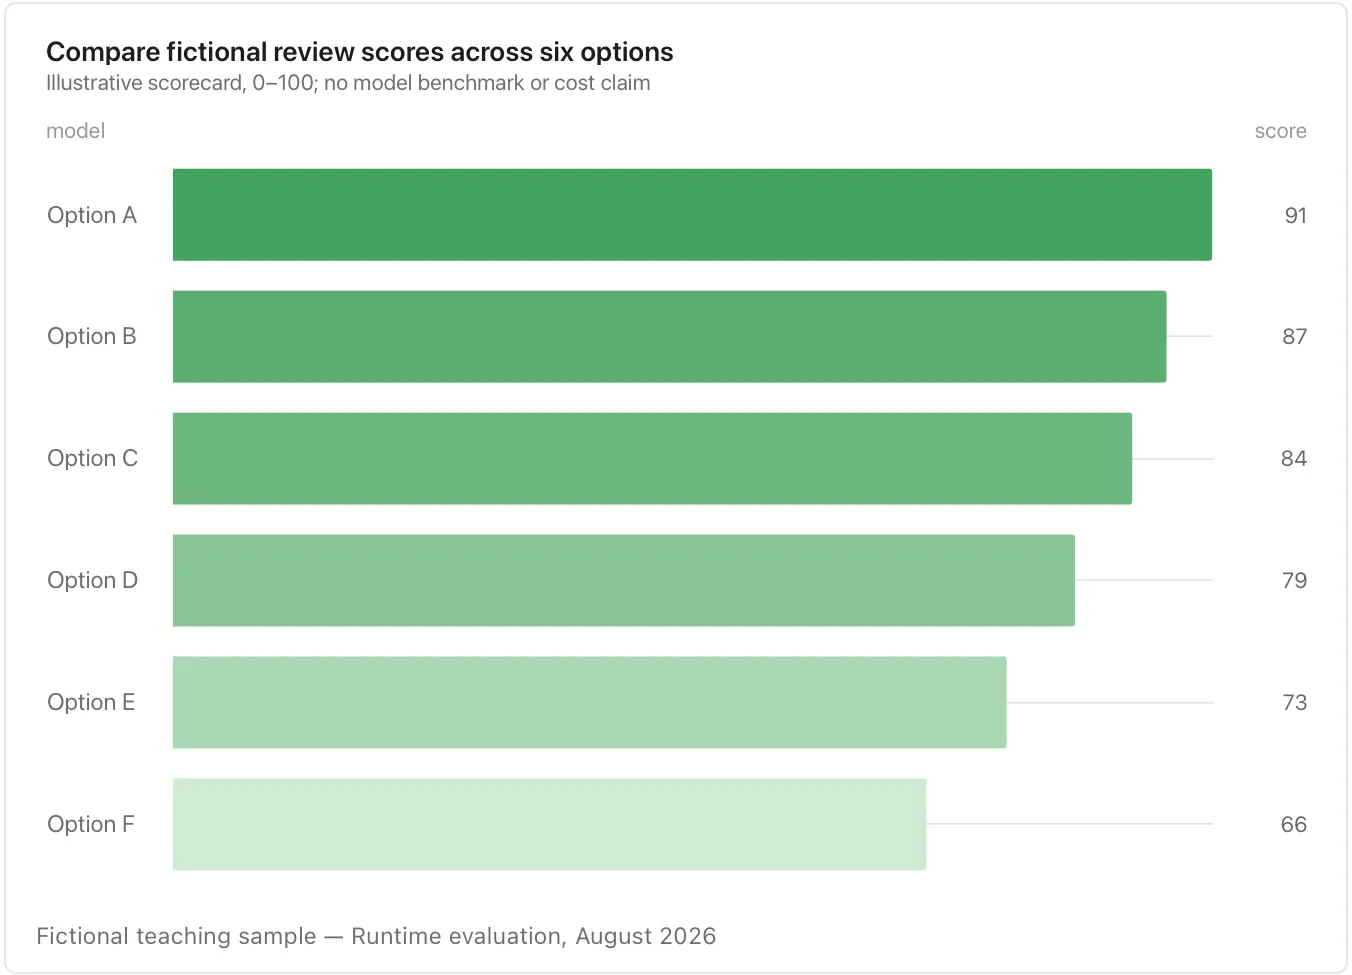
Chart and diagram kinds · Comparison and ranking6 of 54
Pyramid chart
Compare two cohorts across the same bands.
Check whether raw counts or within-cohort percentages answer the question; unequal cohort sizes can dominate the picture.
Takes: a table with an age band or tier column, a two-value side column and a count. That is a population pyramid, or any two cohorts mirrored around a centre.
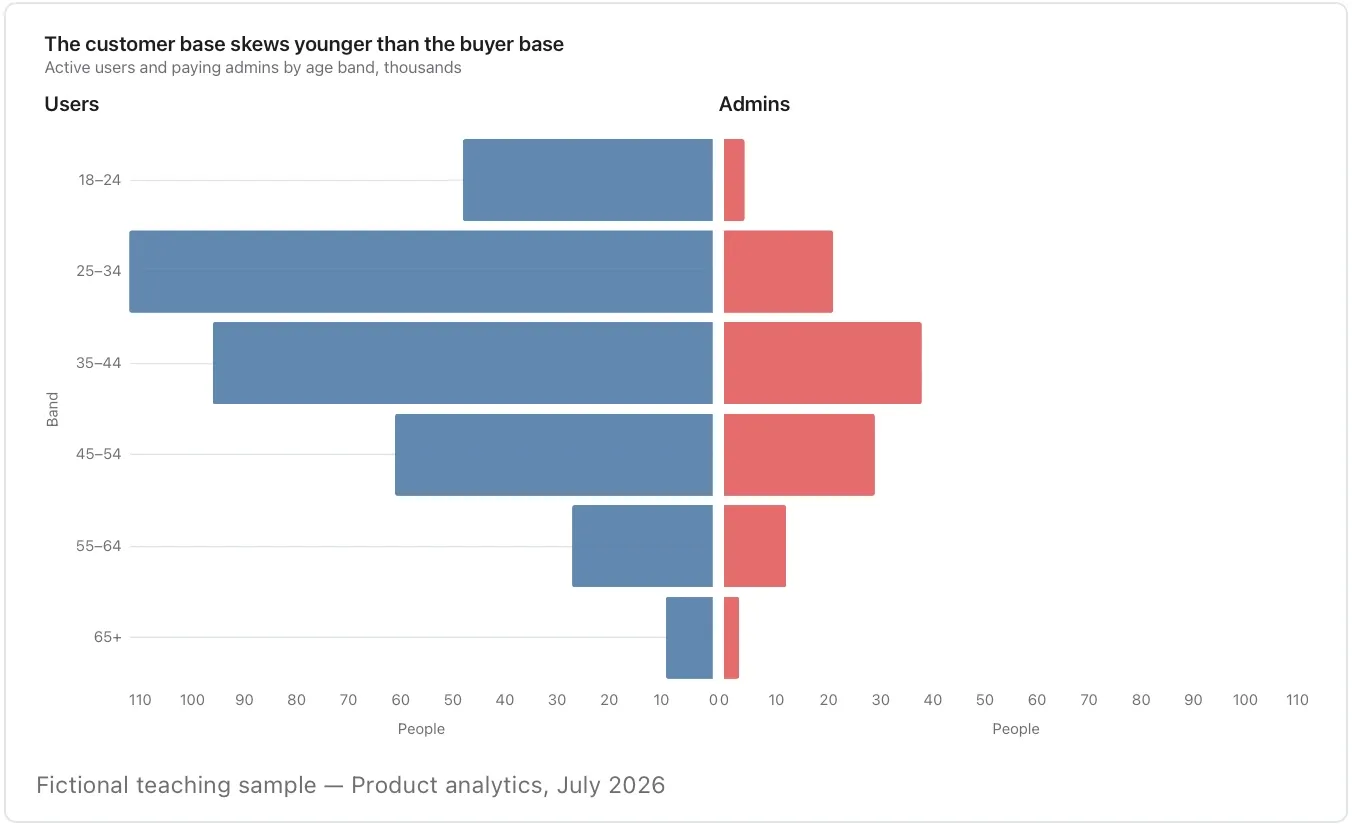
Chart and diagram kinds · Comparison and ranking7 of 54
Bullet chart
Compare an actual value with its own target.
Keep rows in the same unit on a shared axis; put dollars, percentages and days in separate exhibits.
Takes: a table of metrics, each with an actual value and a target. That is the quarterly scorecard, where every row is a measure against its goal.
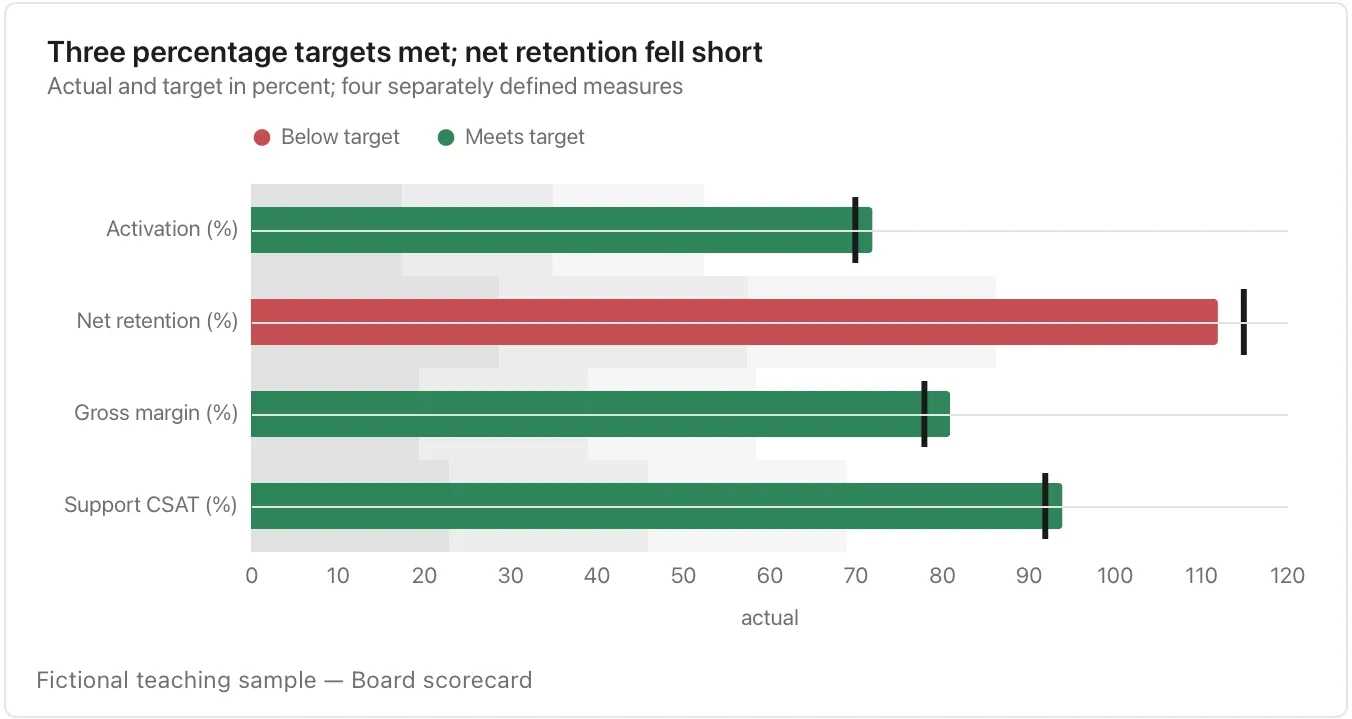
Chart and diagram kinds · Comparison and ranking8 of 54
KPI card
Give one important measure a clear value, unit and comparison.
A card needs its period and denominator nearby; it should not replace the evidence behind the number.
Takes: a single line or a one-row table naming a metric, its current value and its target. That is the one number the page is about.
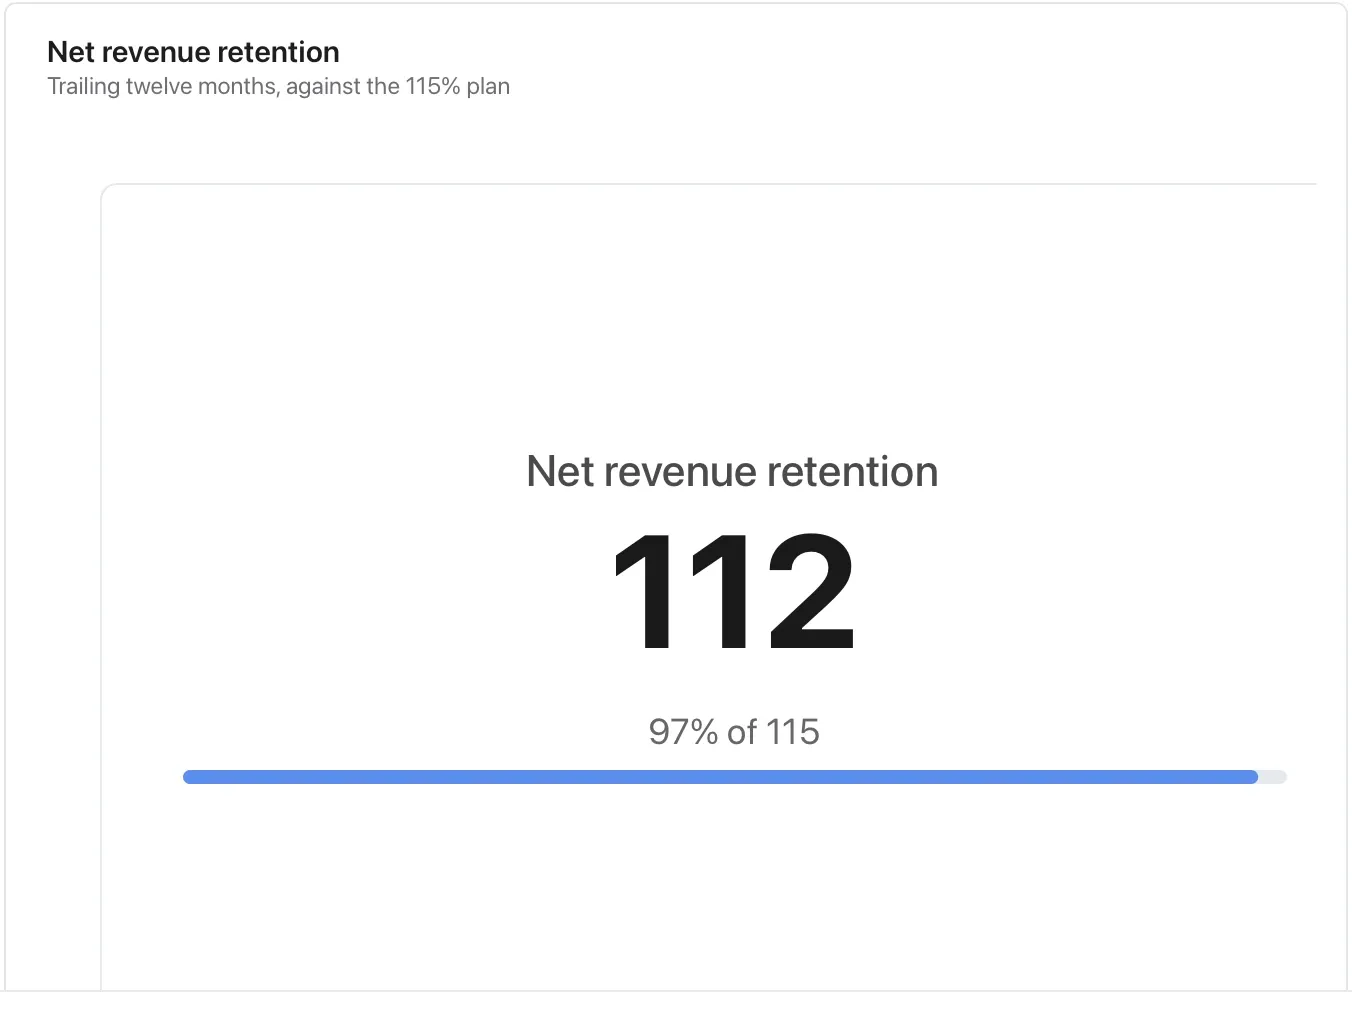
Chart and diagram kinds · Change over time9 of 54
Line chart
Compare observations in time order.
A line joins the supplied points; sparse observations do not establish what happened between them.
Takes: a table with a date column and one or more numeric series columns, or a long table of date, series, value, such as weekly actives, monthly revenue or daily latency.
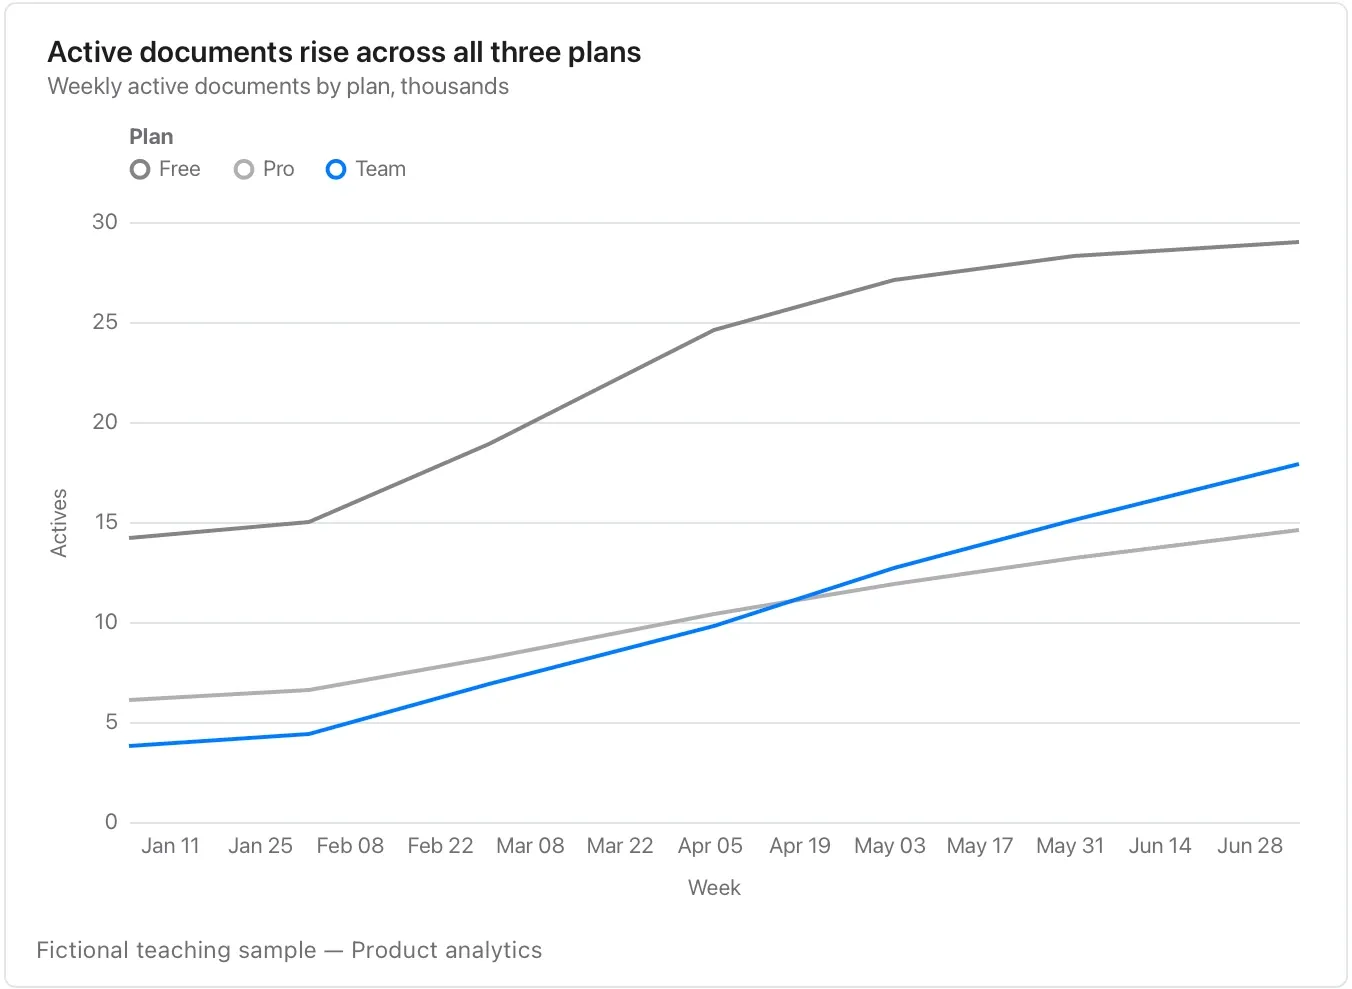
Chart and diagram kinds · Change over time10 of 54
Area chart
Emphasize the amount of a volume or balance over time.
Keep a meaningful zero; a cash balance alone cannot establish runway without a spending basis.
Takes: a date column and one cumulative or volume measure, such as total storage, cumulative signups or cash balance, where the filled area reads as the amount.
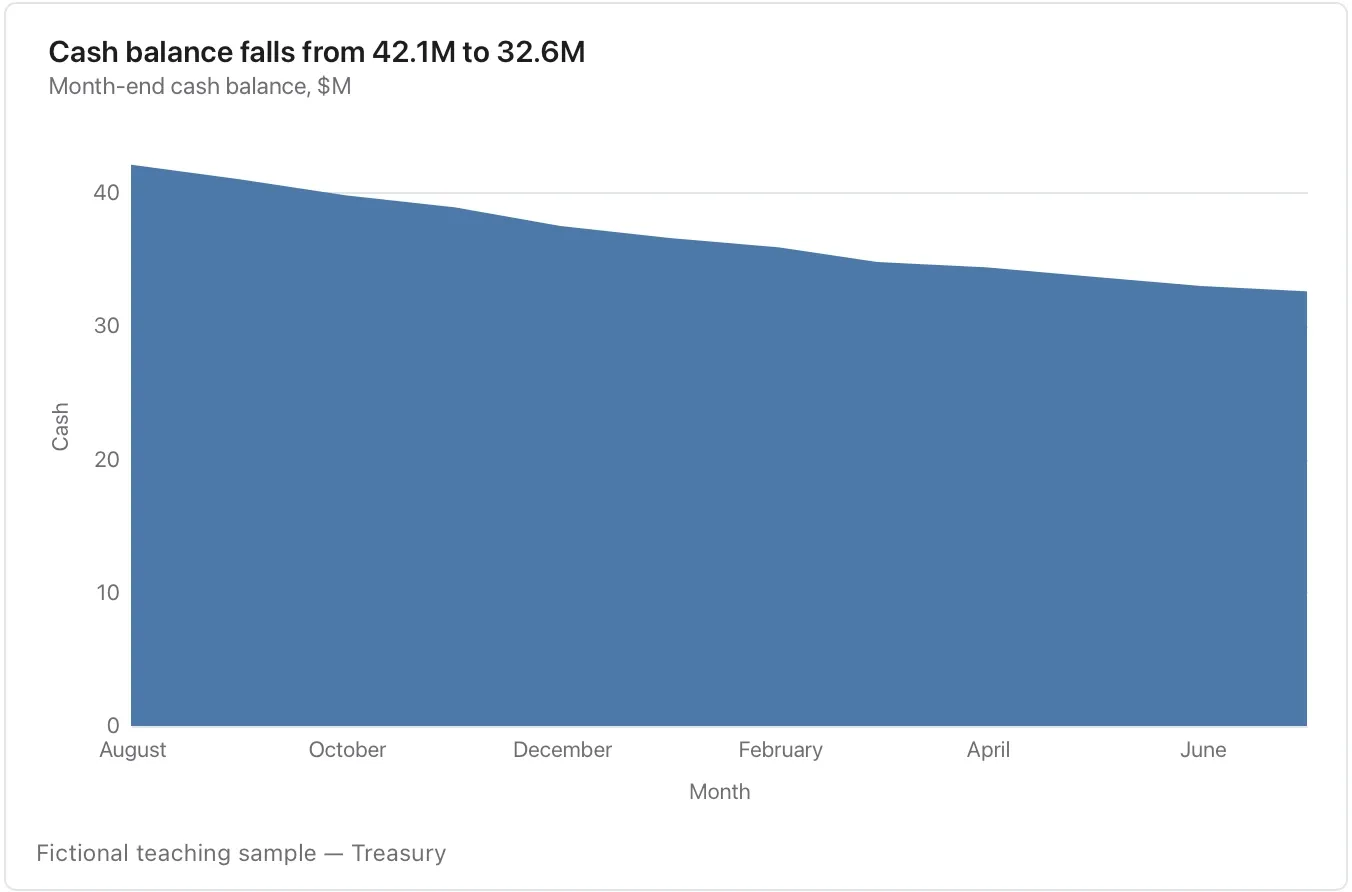
Chart and diagram kinds · Change over time11 of 54
Streamgraph
Explore how several parts change over time.
The moving baseline helps show the mix but makes exact cross-period values harder to compare; use lines when precision is the priority.
Takes: a long table of date, category and value with several categories per date, such as share of attention, traffic by channel or tickets by product, when the story is how the mix shifts.
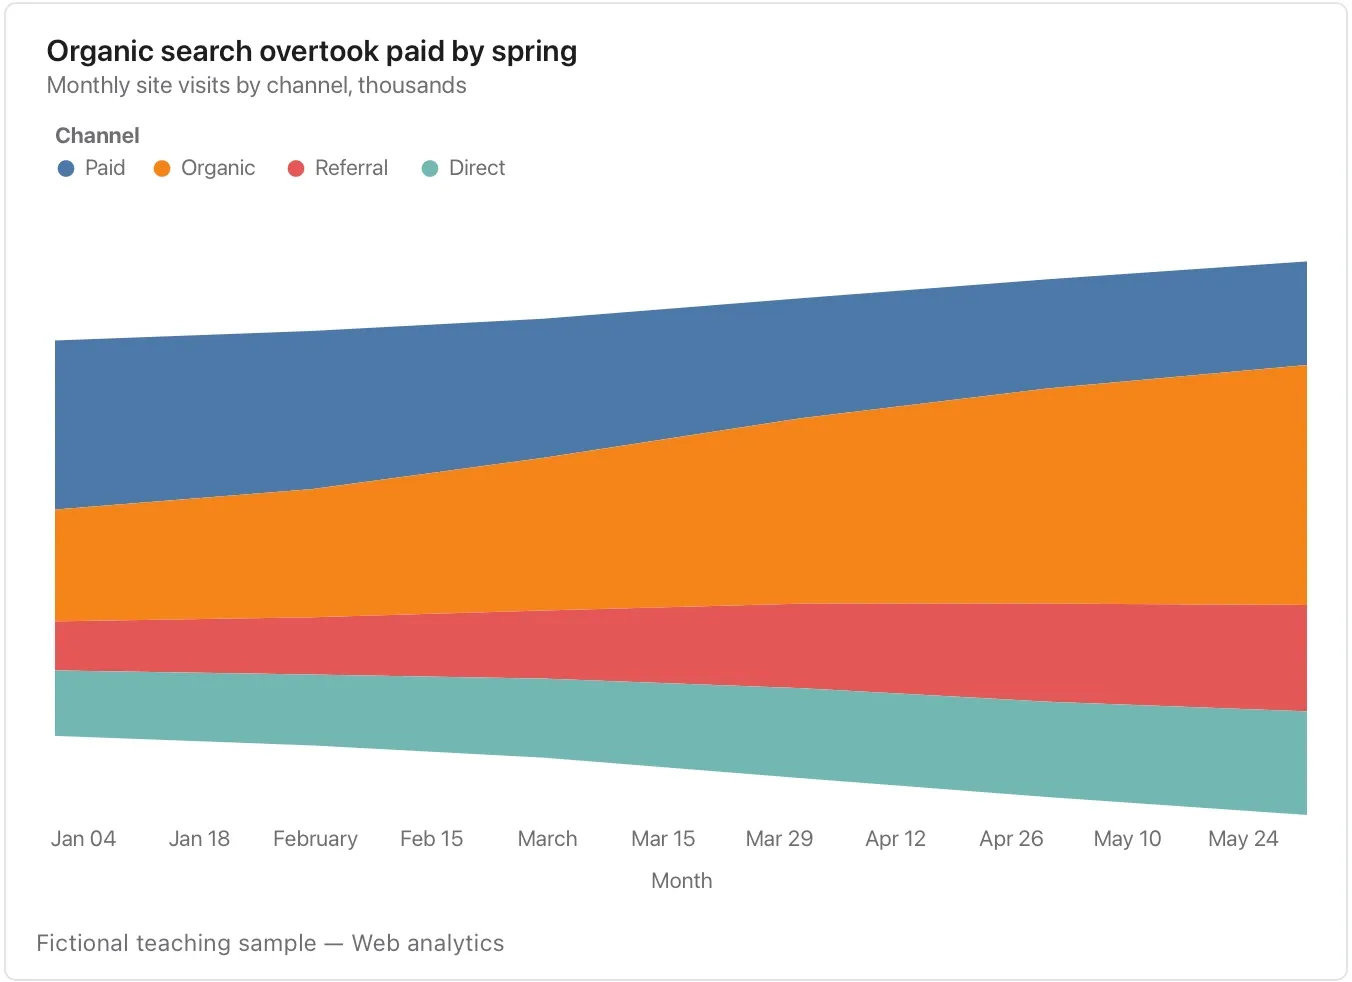
Chart and diagram kinds · Change over time12 of 54
Range area chart
Show a supplied lower and upper range.
Say whether it is a forecast interval, observed spread or scenario range; Flow does not infer its statistical meaning.
Takes: a date column with a low and a high column, and optionally a central value, such as a forecast with its confidence band, a temperature range or a p10/p90 spread.
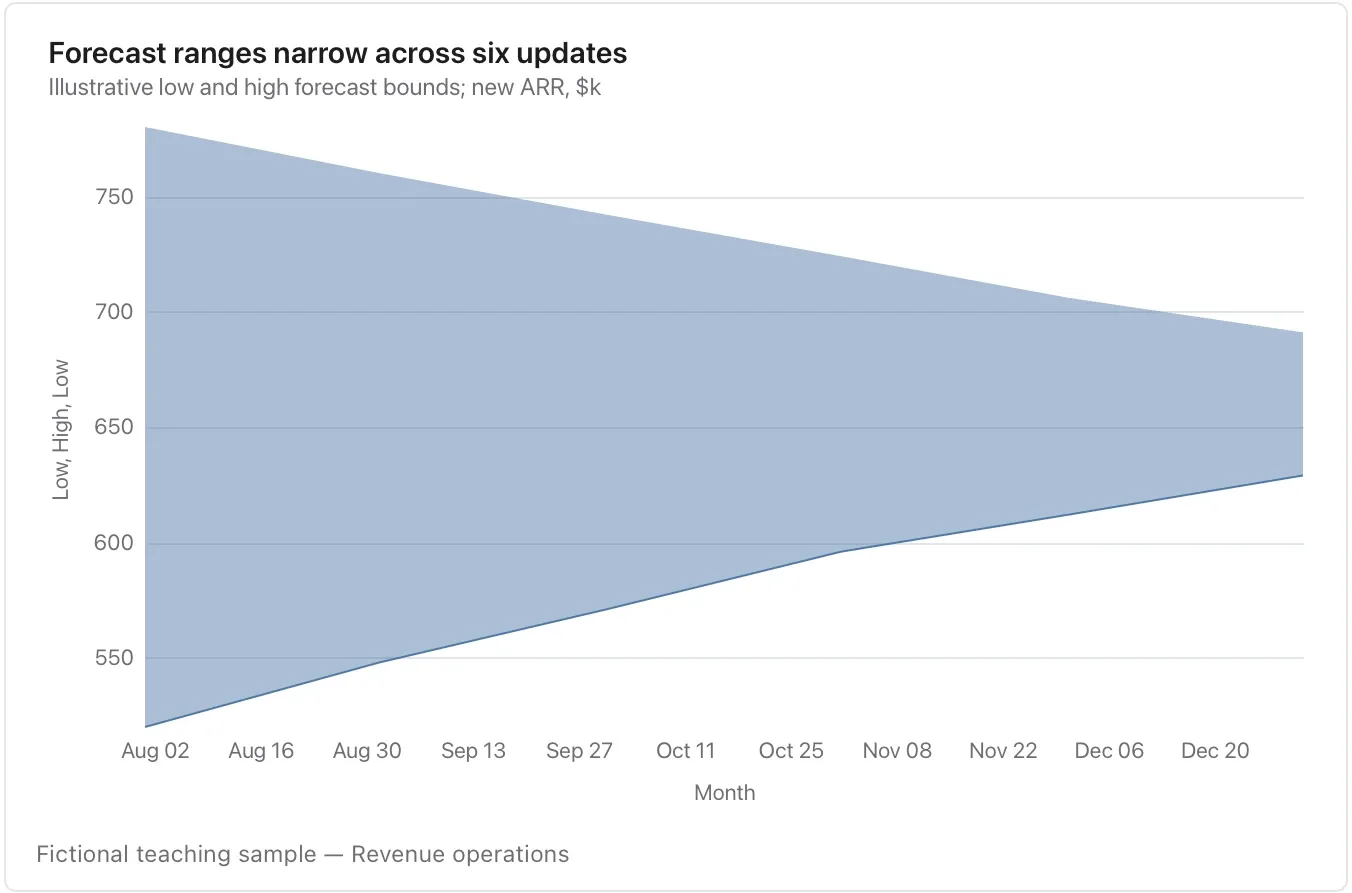
Chart and diagram kinds · Change over time13 of 54
Sparkline
Place a compact trend beside a statement.
Keep the unit, period and scale context in the title or nearby text because the display is deliberately small.
Takes: a short date-and-value table meant to sit beside a sentence, such as a week of latency or a month of signups, shown without axes as a glance.
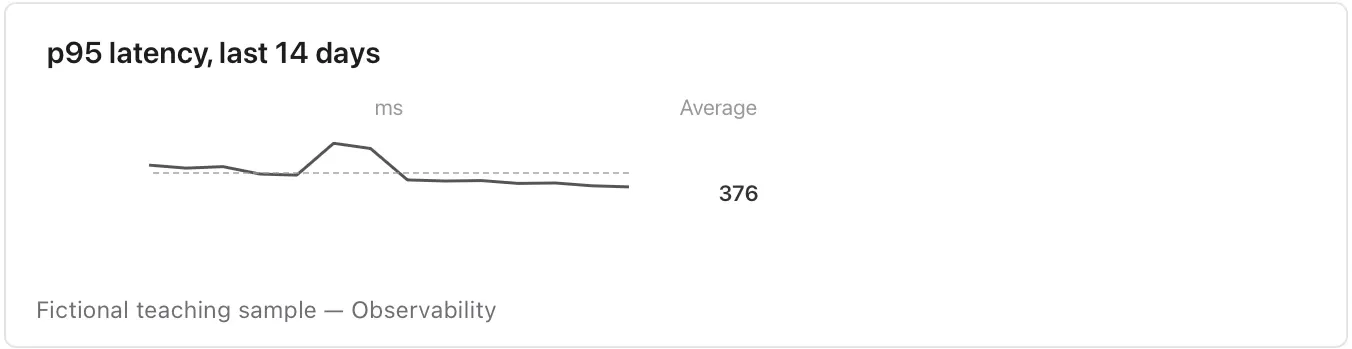
Chart and diagram kinds · Change over time14 of 54
Slope chart
Compare exactly two named periods for each item.
The gap and direction matter; it cannot show the path or volatility between endpoints.
Takes: a table with exactly two time points per item, such as before and after or this year and last, where the steepness of each line is the finding.
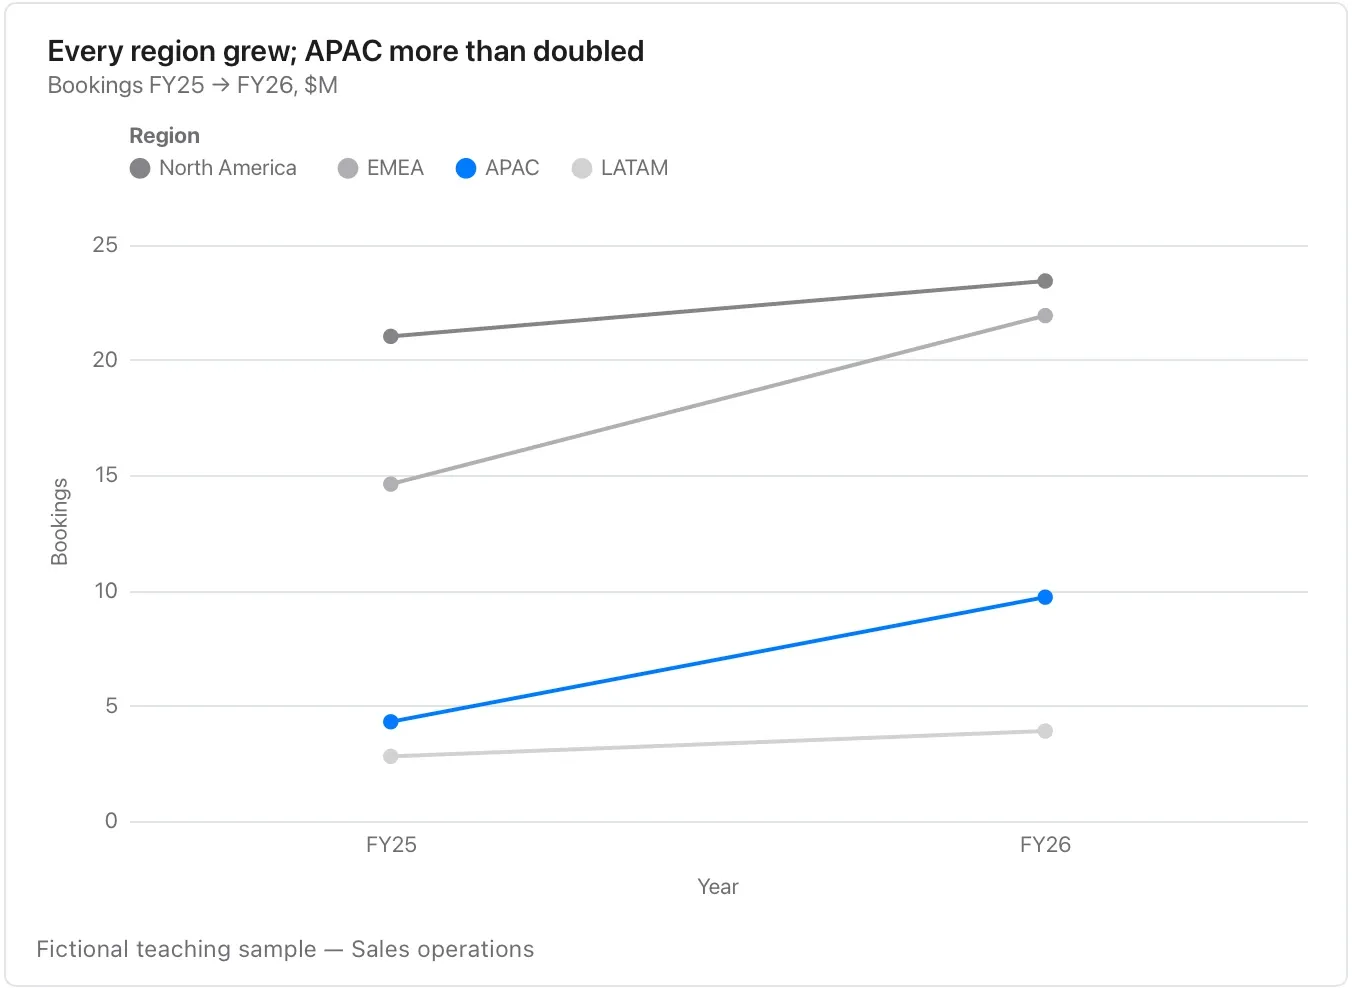
Chart and diagram kinds · Change over time15 of 54
Bump chart
Track rank changes across periods.
Define the ranking method and ties; moving from second to first says nothing about the size of the underlying gap.
Takes: a table of period, competitor and rank. That is the league table at each point in time, when the story is who passed whom.
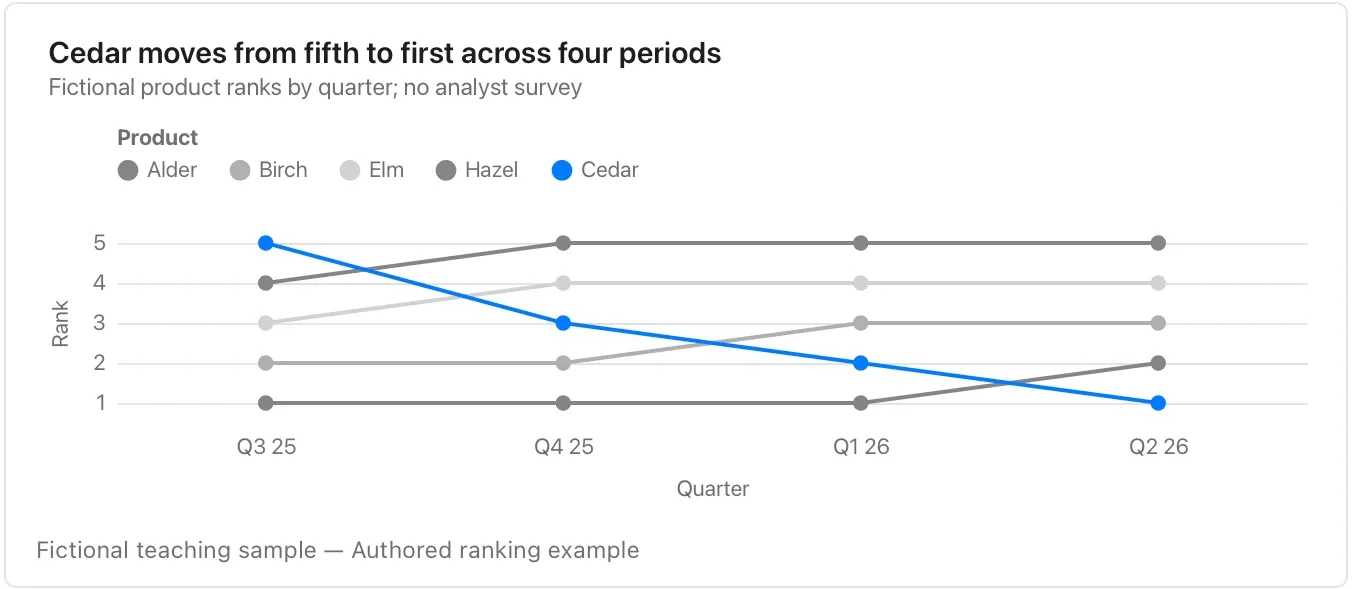
Chart and diagram kinds · Change over time16 of 54
Connected scatter plot
Follow one entity through time on two quantitative axes.
Preserve chronological order and both units; the connecting path is a trajectory, not a regression fit.
Takes: a table of period, x-measure and y-measure for one entity, such as price against volume by year or spend against growth by quarter, where the path shows the trajectory.
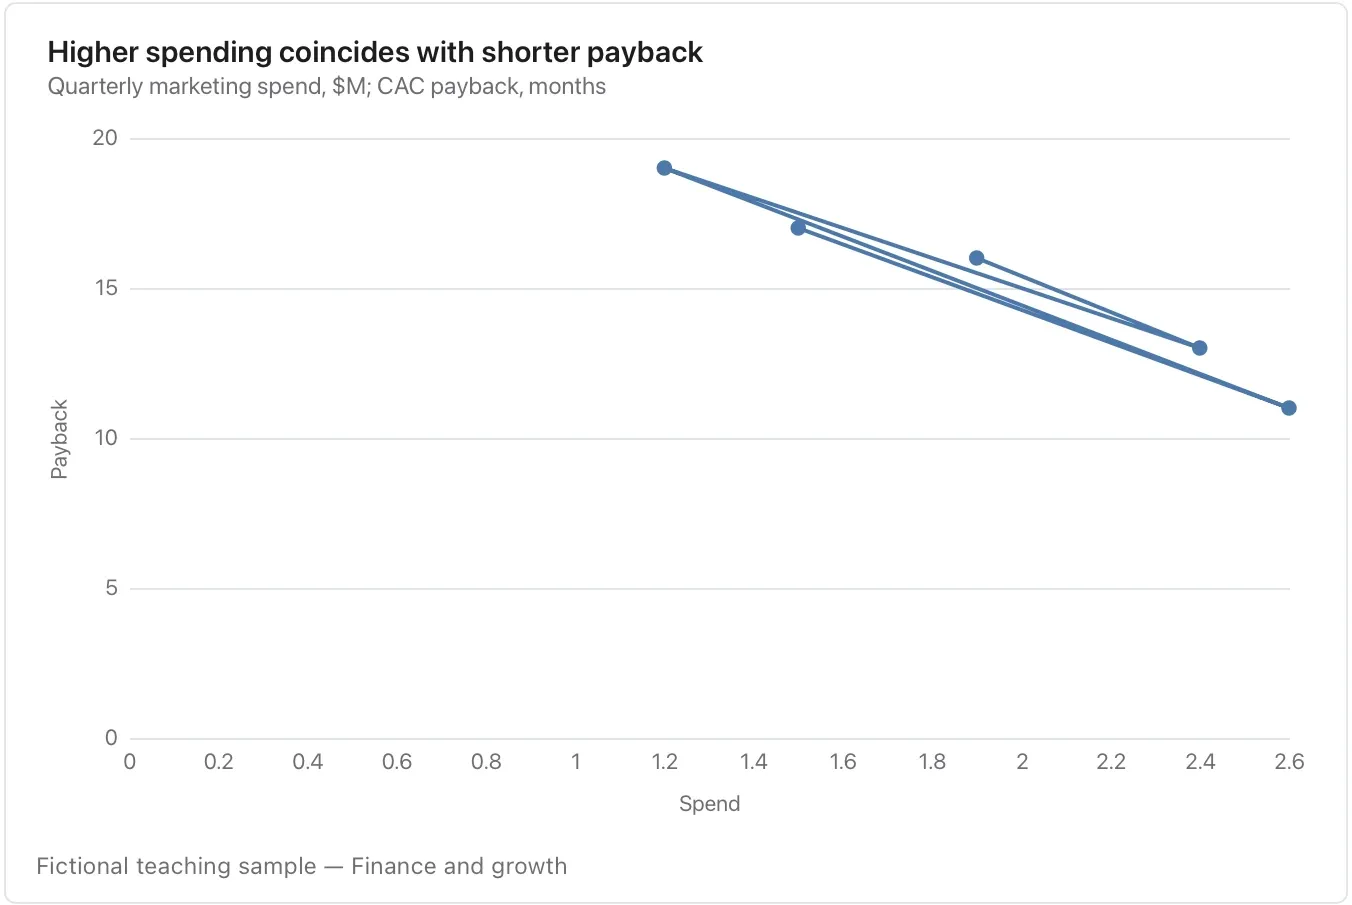
Chart and diagram kinds · Change over time17 of 54
Candlestick chart
Show an opening value, high, low and closing value for each period.
Check the time zone, sampling window and units; it is not an investment recommendation.
Takes: a table of date, open, high, low and close. That means market prices, but also any daily range with a start and an end, such as queue depth or token spend.
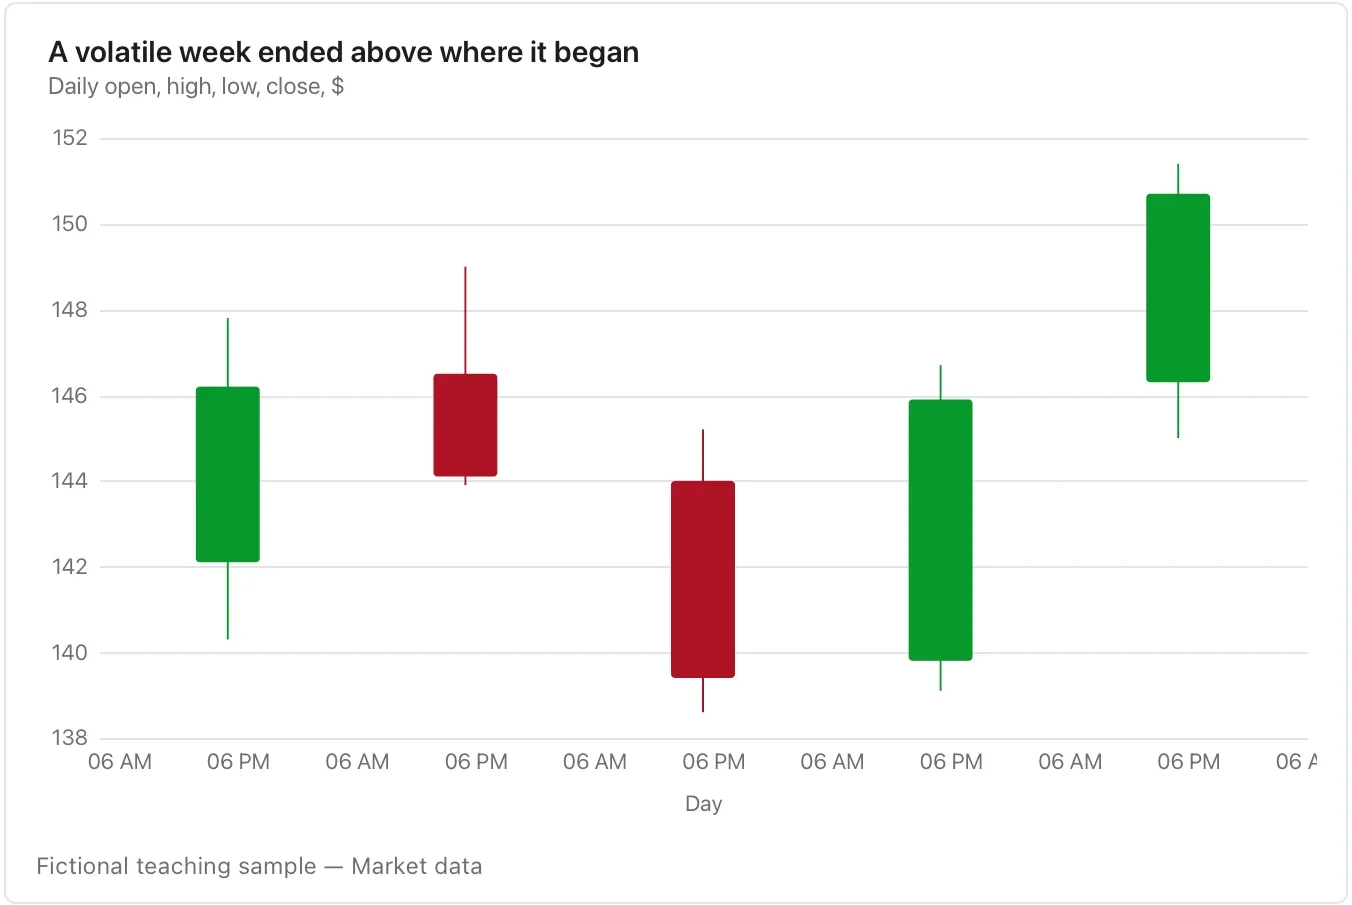
Chart and diagram kinds · Change over time18 of 54
Calendar heatmap
Read daily rhythm across weeks and months.
Missing days need explicit treatment; a quiet day is not necessarily a zero or a day when a system was available.
Takes: a long table of date and count, such as commits, dictation minutes or support tickets per day, over months, when the weekly rhythm matters as much as the totals.
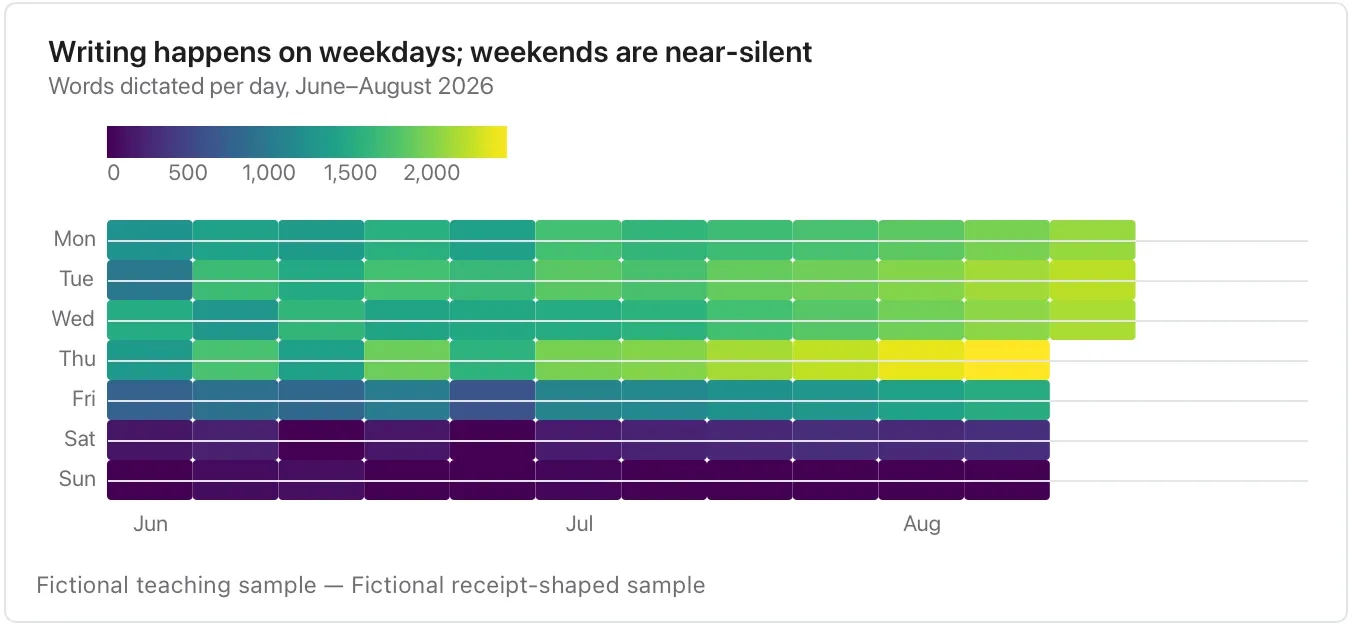
Chart and diagram kinds · Composition and flow19 of 54
Waterfall chart
Reconcile an opening amount through signed movements to a closing amount.
Check the arithmetic and distinguish totals from changes; a missing movement cannot be repaired by the chart.
Takes: a table of named steps and signed amounts, from an opening figure through additions and subtractions to a closing one, such as a revenue bridge or a headcount reconciliation.
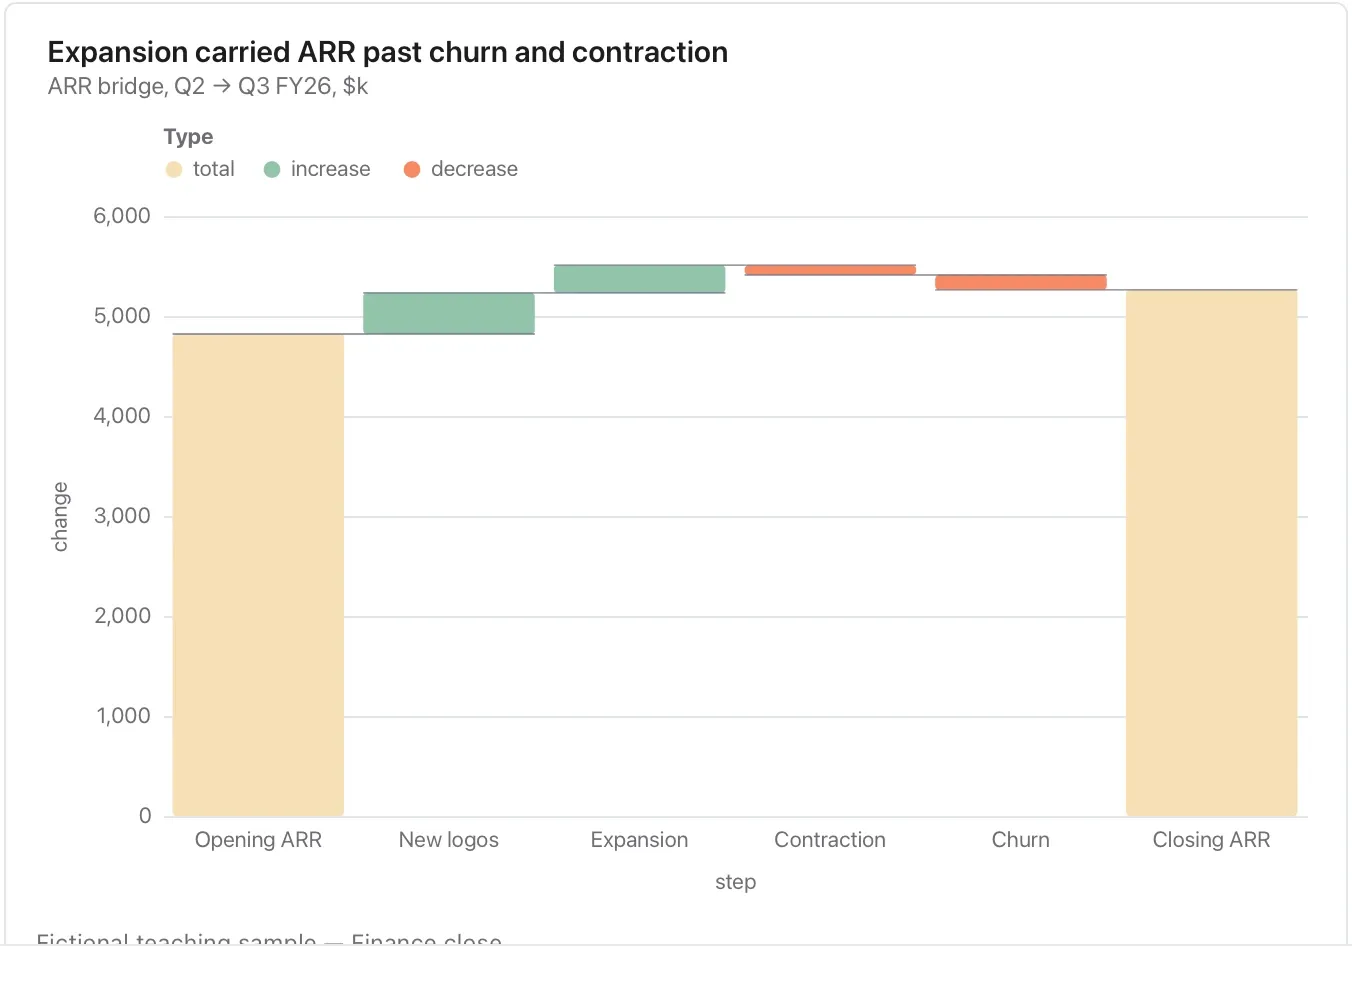
Chart and diagram kinds · Composition and flow20 of 54
Pie chart
Show a few nonnegative parts of a single meaningful whole.
State the denominator; use bars for close values, many categories or overlapping groups.
Takes: a short table of parts and their share. That means five or fewer slices that add to a whole, such as revenue by segment or time by activity.
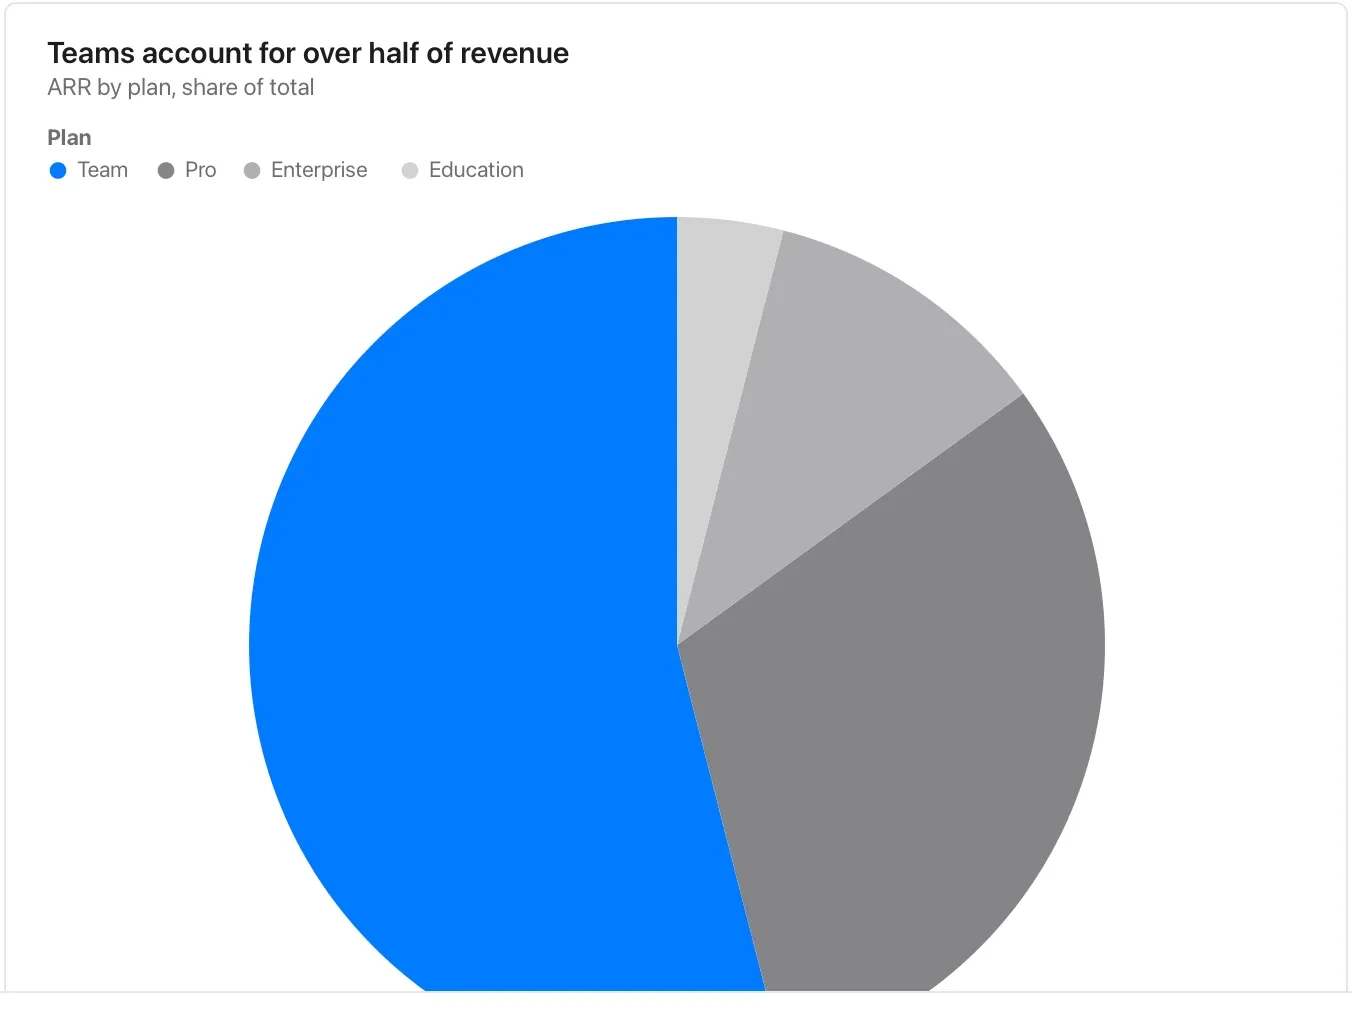
Chart and diagram kinds · Composition and flow21 of 54
Donut chart
Use a compact part-to-whole view with a clear total nearby.
Angles are harder to compare than lengths; keep exact amounts available in a table or paired bar chart.
Takes: the same parts-and-share table as a pie, when a headline number belongs in the centre or the chart sits inline beside text.
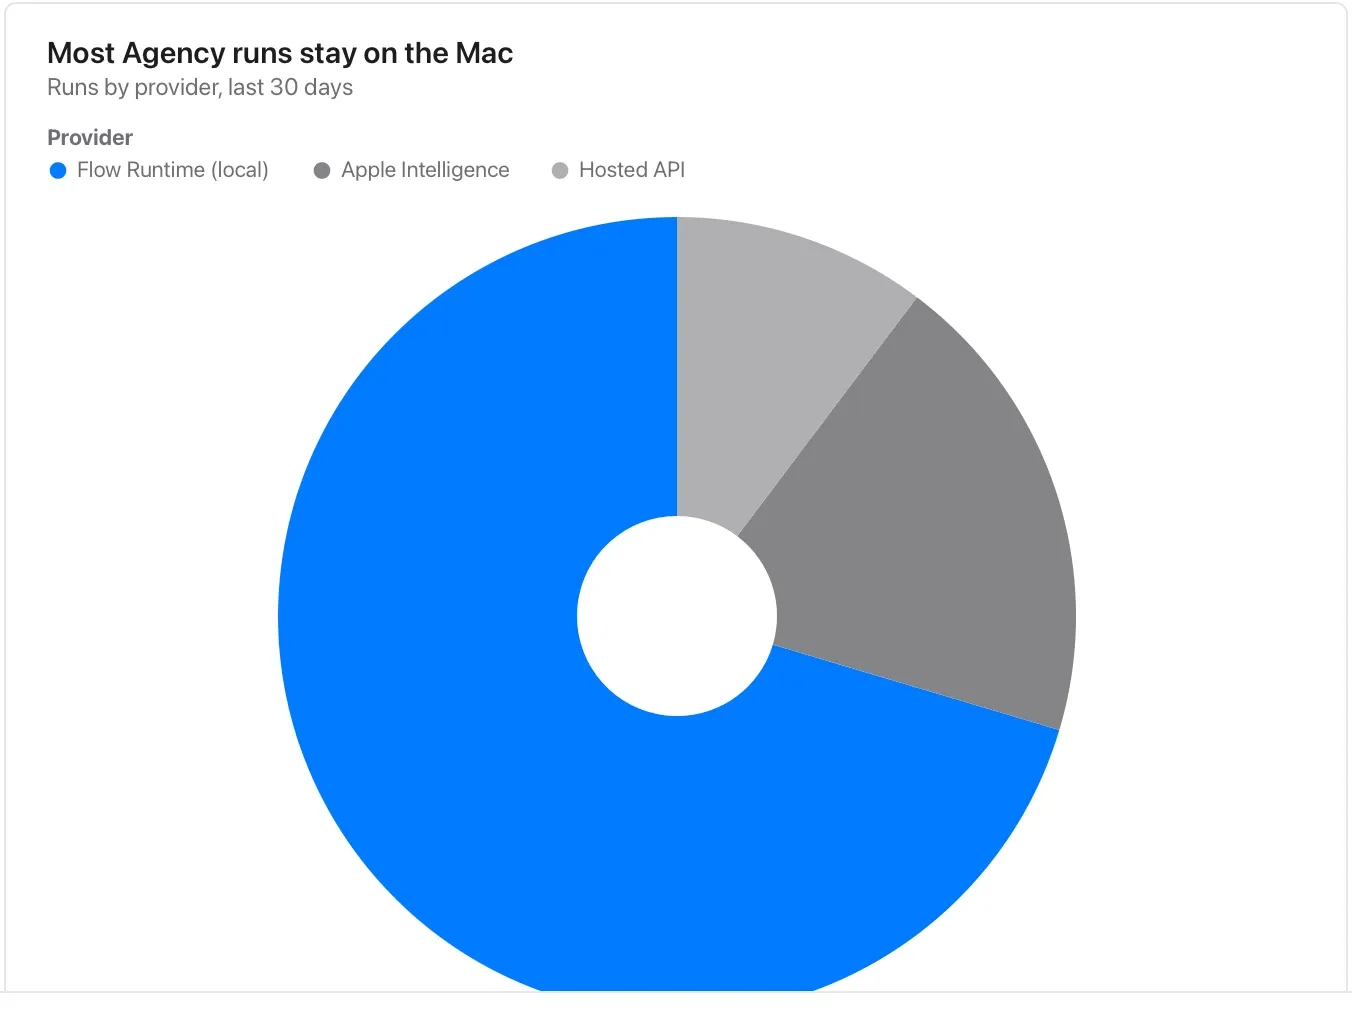
Chart and diagram kinds · Composition and flow22 of 54
Rose chart
Explore ordered cyclical categories such as weekdays.
Explain the period and magnitude; radius and area can give different visual impressions, so keep the underlying values available.
Takes: a table of cyclical categories and a magnitude, such as hours of the day, months or compass directions, where a polar layout shows the cycle.
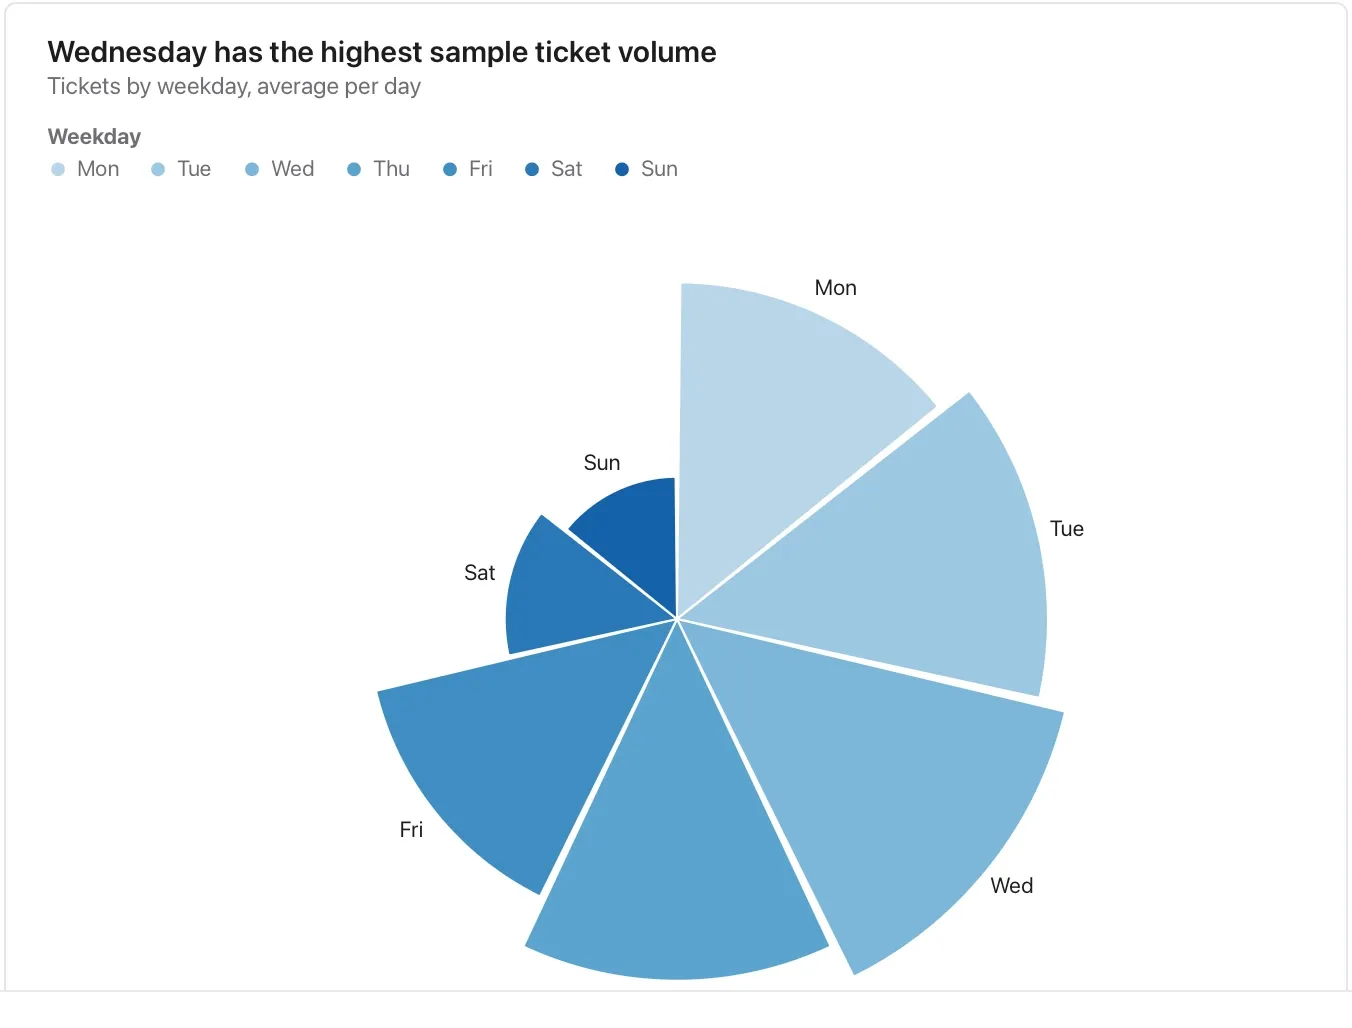
Chart and diagram kinds · Composition and flow23 of 54
Radar chart
Compare a few profiles on shared criteria.
Define each score and direction, use comparable scales and inspect the table; polygon area is not a defensible overall score.
Takes: a table of criteria, option and score, such as a vendor evaluation or a skills matrix, with two or three options scored on five to eight axes.
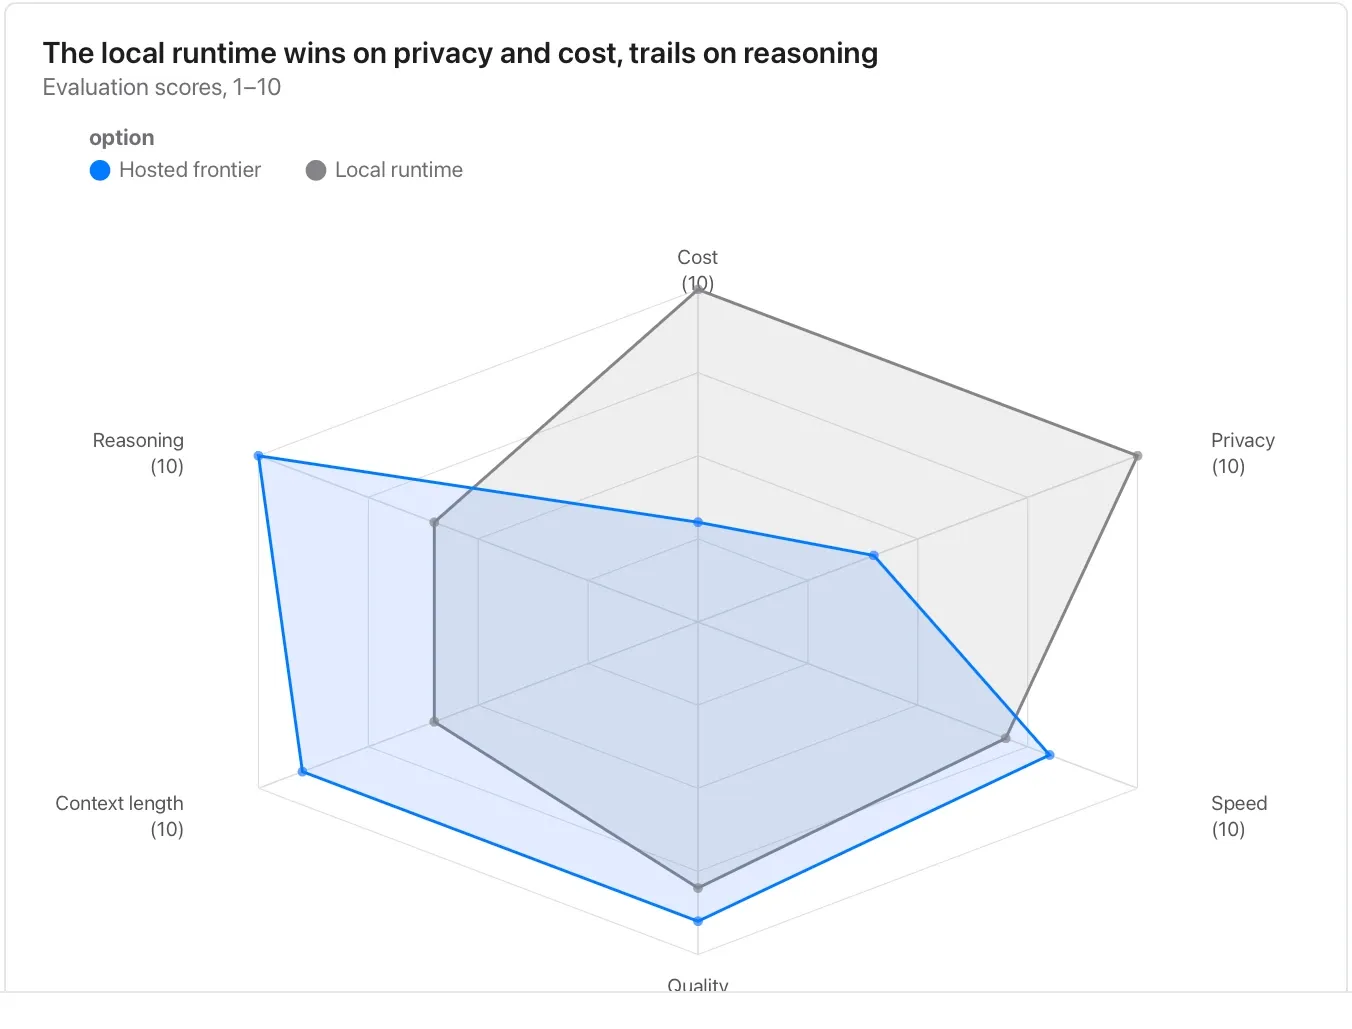
Chart and diagram kinds · Composition and flow24 of 54
Gantt chart
Show authored start and finish dates, overlaps and handovers.
Bars represent the entered schedule; they do not prove work started or that a dependency is satisfied.
Takes: a table of tasks with a start date, an end date and an owner or phase, such as a project plan or release schedule written as rows.
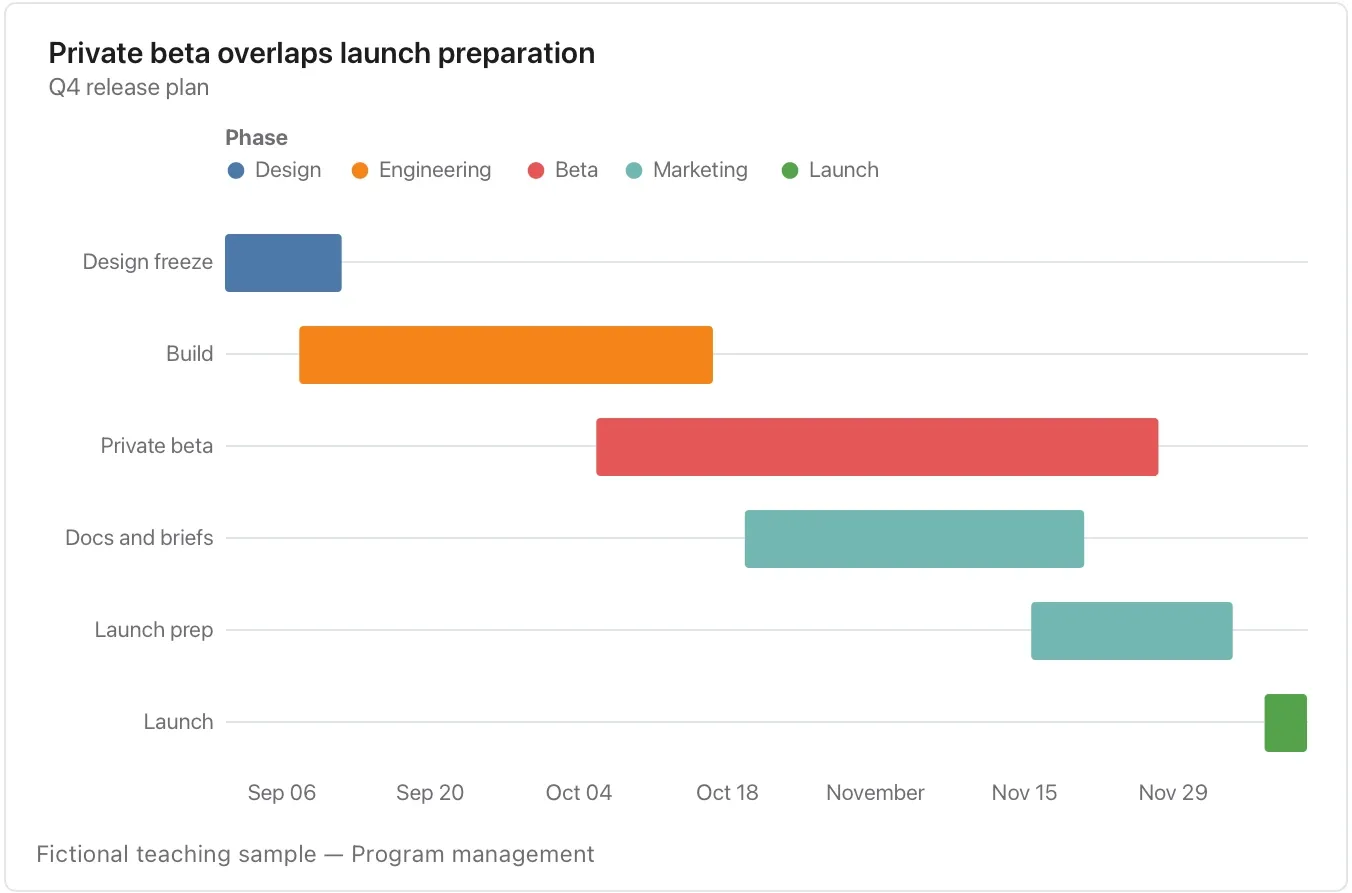
Chart and diagram kinds · Distribution and relationship25 of 54
Scatter plot
Look for a relationship between two measures on the same rows.
Label both units and investigate outliers; association does not establish cause.
Takes: a table with two numeric columns per row, and optionally a category and a size, such as accounts by seats and spend or models by latency and quality.
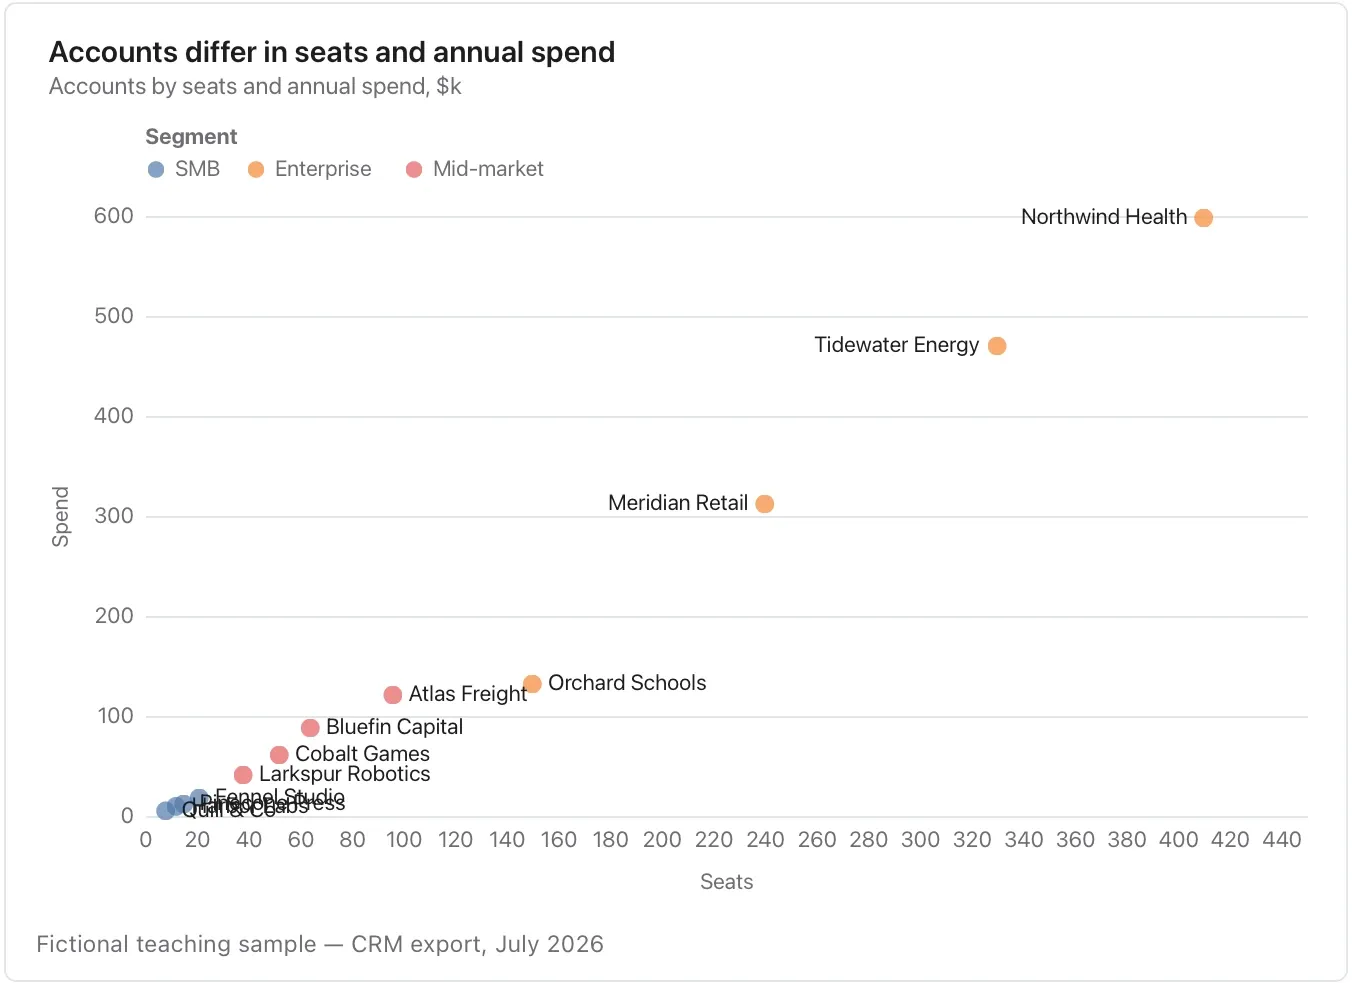
Chart and diagram kinds · Distribution and relationship26 of 54
Regression
Summarize the fitted relationship between two numeric measures.
Keep the points visible and avoid causal language or predictions beyond the observed range.
Takes: the same two numeric columns as a scatter, when you want the fitted trend drawn through them, such as ad spend against signups or effort against score.
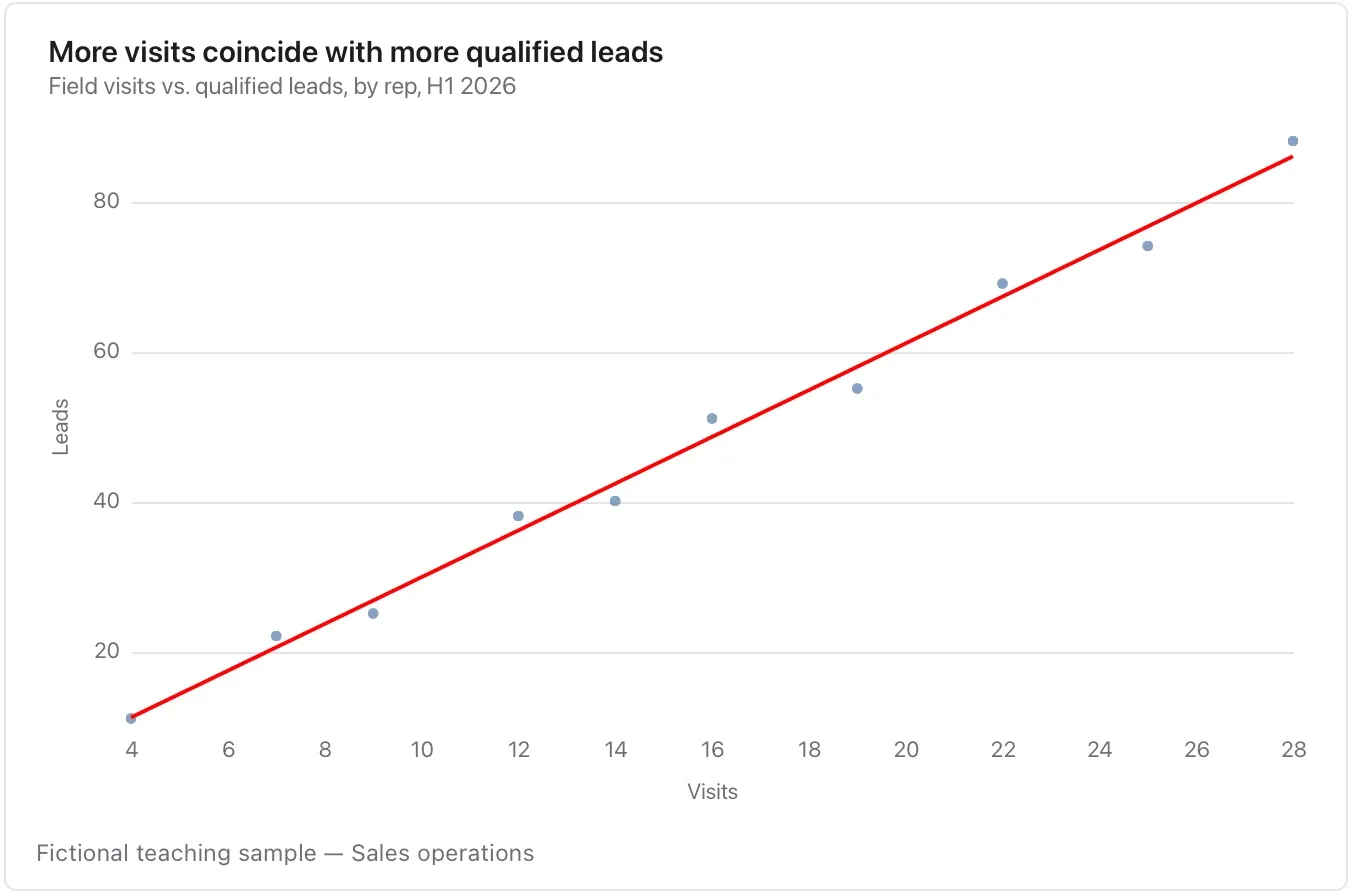
Chart and diagram kinds · Distribution and relationship27 of 54
Histogram
Inspect the distribution of one measure.
Bin choices change the visible shape; state the sample size and unit and do not treat an empty bin as missing data.
Takes: a single numeric column with many rows, such as response times, deal sizes or document lengths, which the chart bins for you.
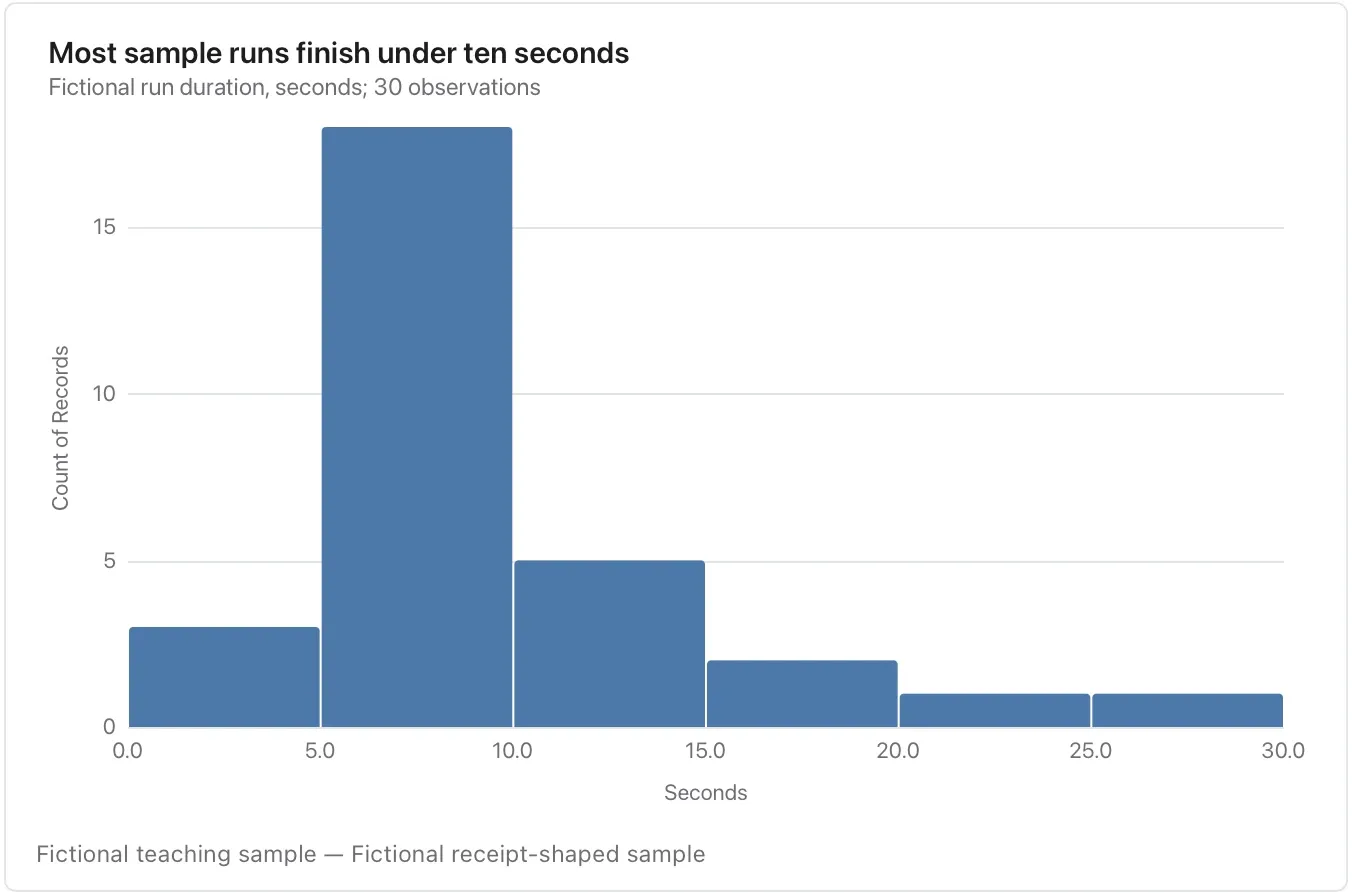
Chart and diagram kinds · Distribution and relationship28 of 54
Density plot
Compare smoothed distribution shapes.
Smoothing and small samples can create or hide peaks; check individual observations before naming distinct populations.
Takes: one numeric column, optionally with a group column. It is the same data as a histogram, smoothed, when two groups need overlaying.
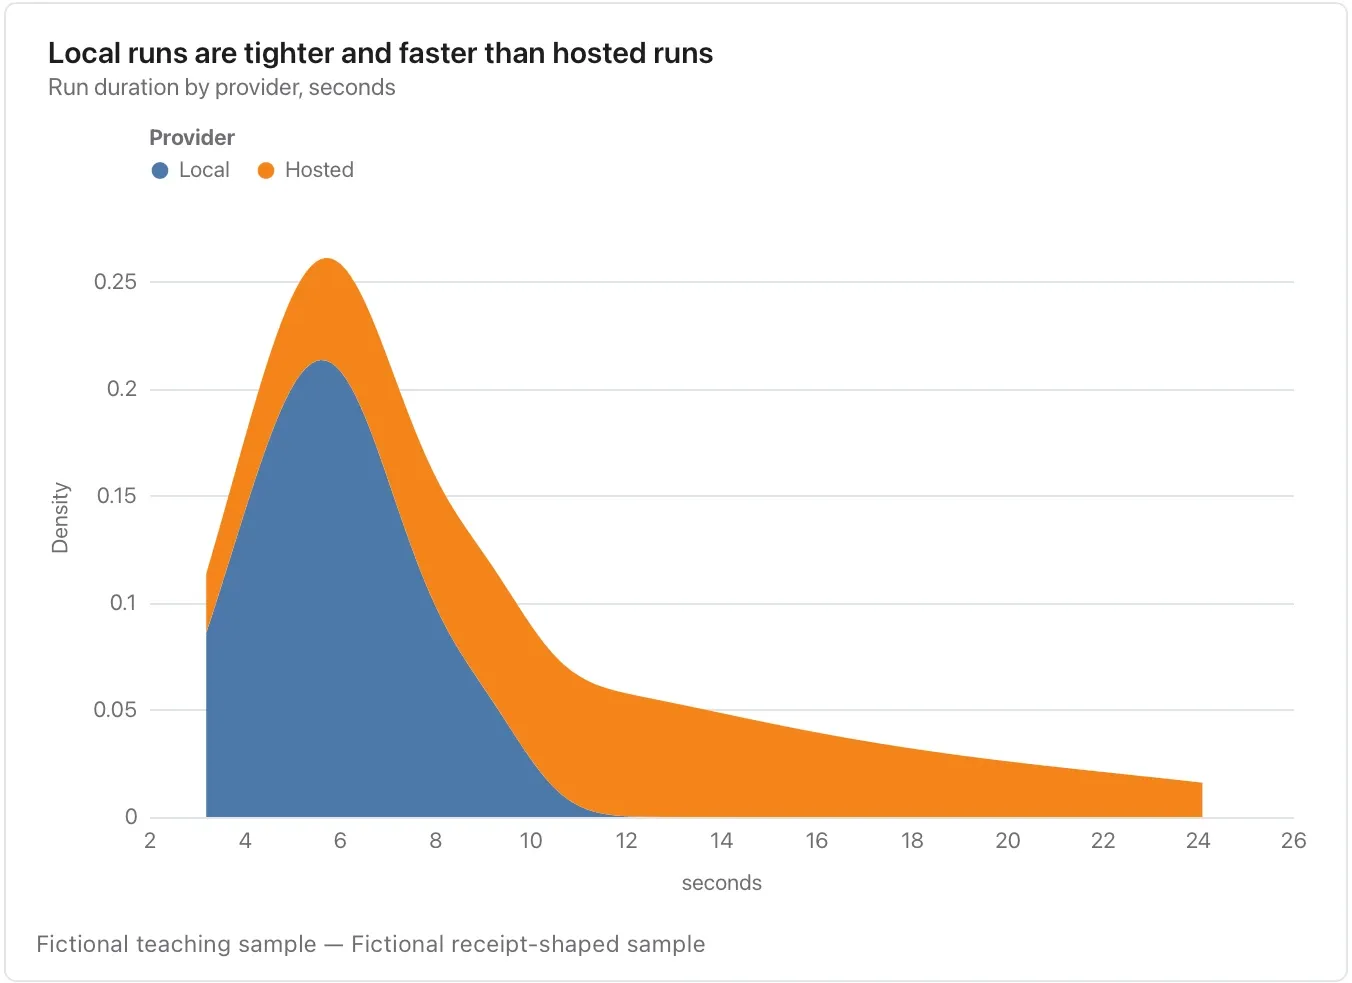
Chart and diagram kinds · Distribution and relationship29 of 54
ECDF plot
Ask what share of observations is at or below a threshold.
State whether equality counts, name the sample size and remember that this is a sample proportion.
Takes: one numeric column, optionally grouped. Use it when the question is “what share finished within N seconds”, read straight off the curve.
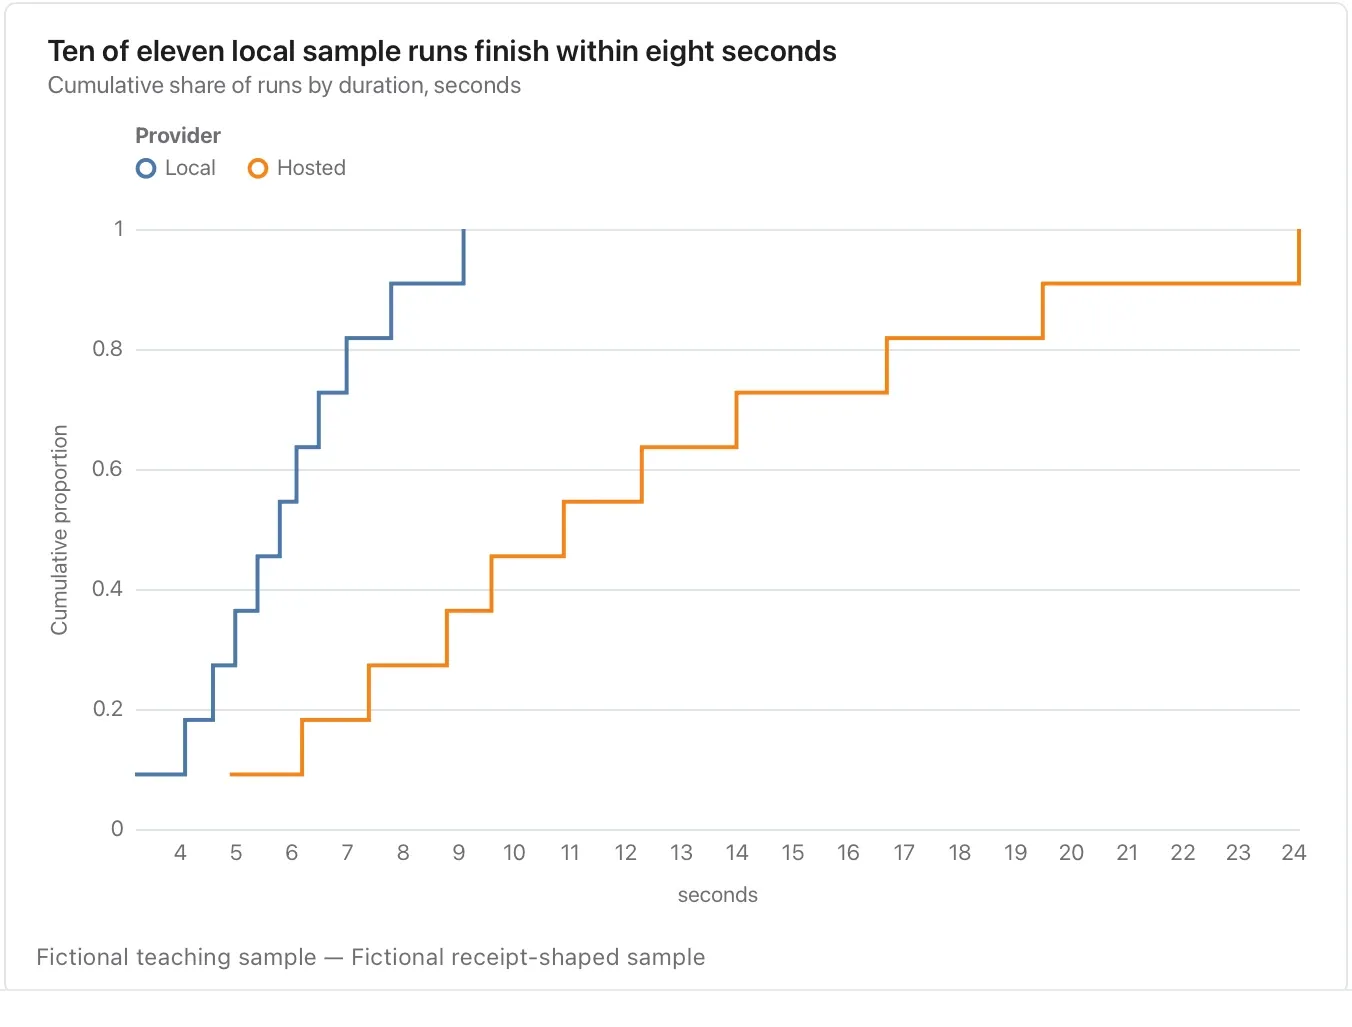
Chart and diagram kinds · Distribution and relationship30 of 54
Boxplot
Compare medians, quartiles and flagged outliers across groups.
The box hides the individual pattern; a strip plot can be better for a handful of observations.
Takes: a category column and a numeric column with several rows per category, such as deal size by segment or score by cohort, summarised as median, quartiles and outliers.
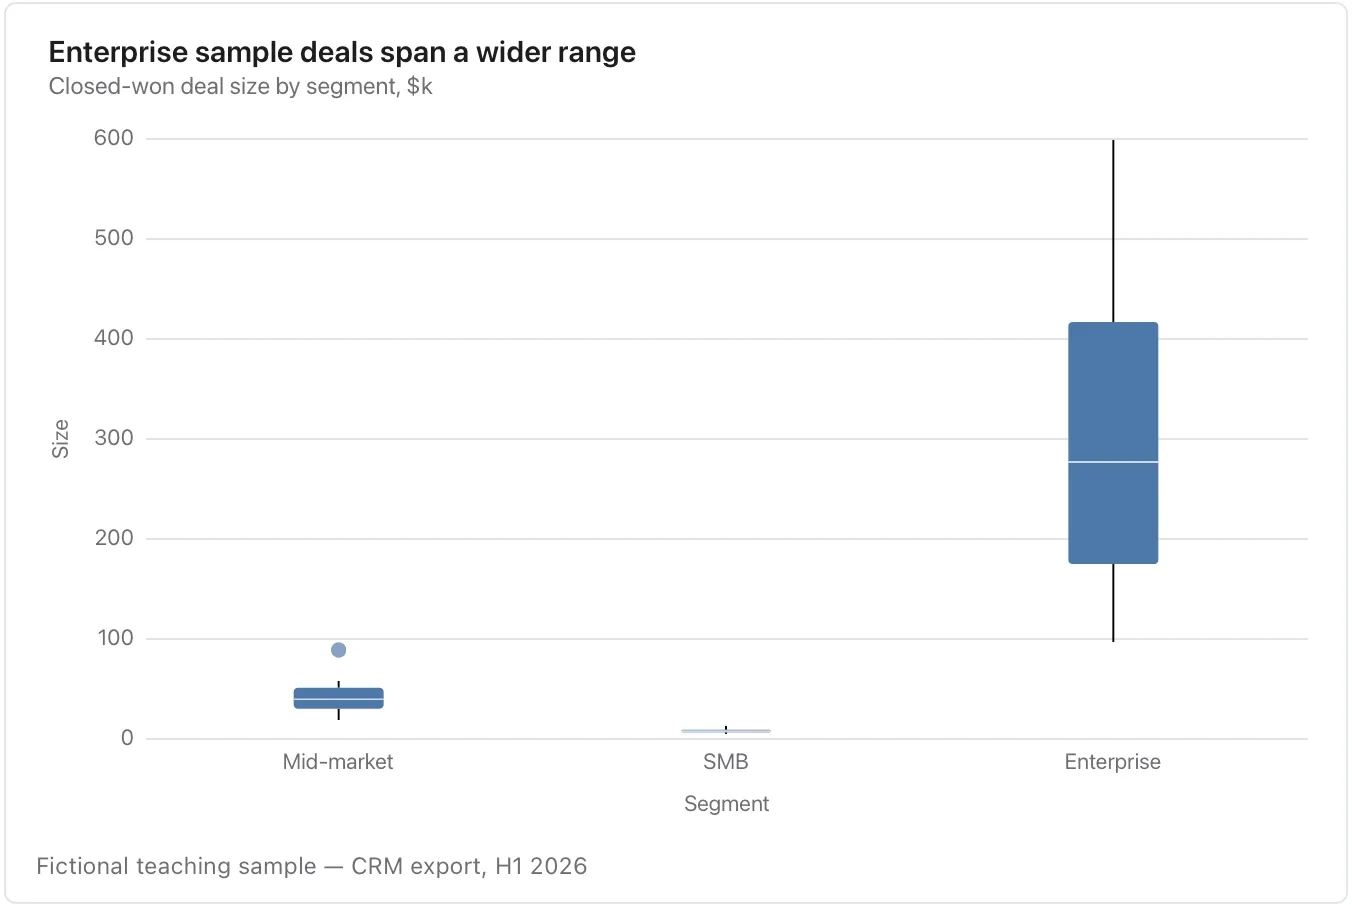
Chart and diagram kinds · Distribution and relationship31 of 54
Violin plot
Compare the shape of distributions, including possible multiple peaks.
Check sample size and smoothing; a suggestive shape is not evidence for a user persona.
Takes: the same category-and-value table as a boxplot, when the shape of each distribution, such as bimodal or skewed, is the point.
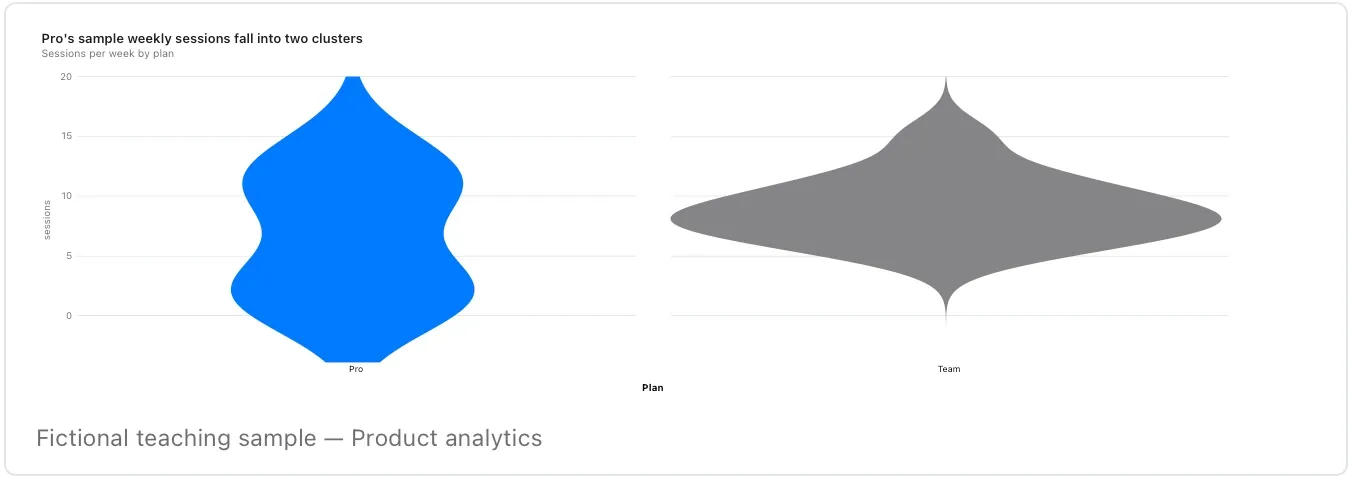
Chart and diagram kinds · Distribution and relationship32 of 54
Strip plot
Show every observation in a modest sample.
Repeated values may overlap; check the count and use the source table when exact individual values matter.
Takes: a category column and a numeric column with a modest number of rows per category, when every individual point should stay visible.
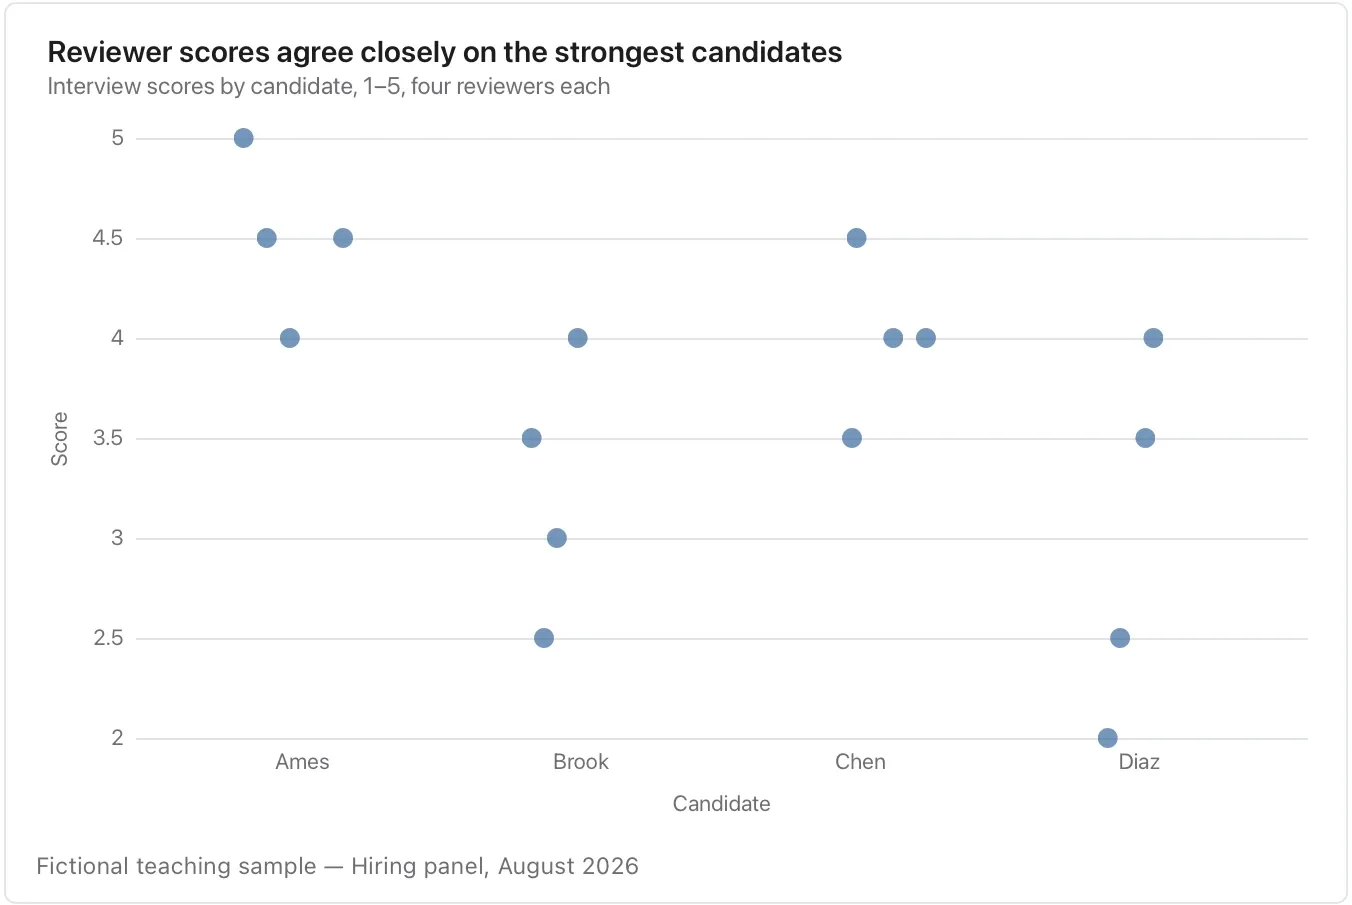
Chart and diagram kinds · Distribution and relationship33 of 54
Ranged dot plot
Compare two observations for each item with less ink than paired bars.
Name both endpoints; this before/after layout does not establish what caused a change.
Takes: a table with a category, a condition and a numeric value, with two rows per category. The before and after values appear as two dots joined by a line.
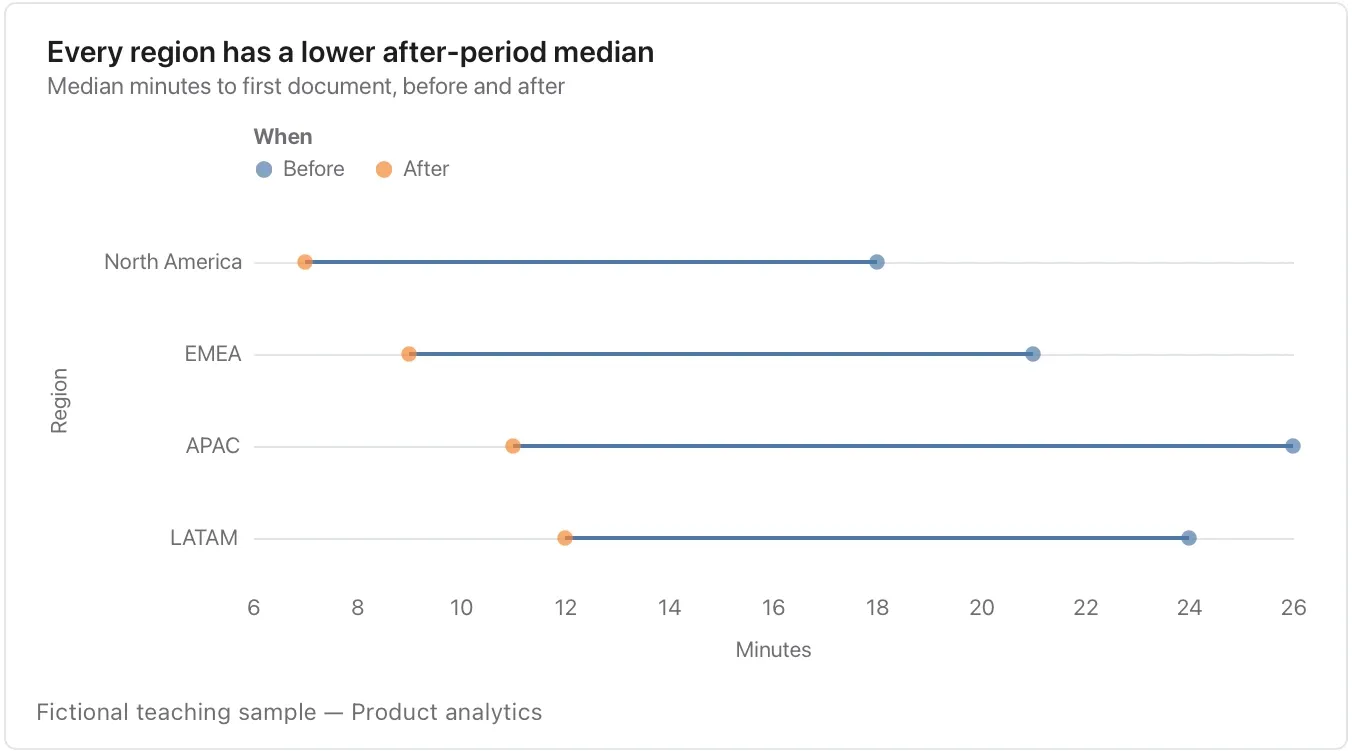
Chart and diagram kinds · Distribution and relationship34 of 54
Heatmap
Inspect a matrix of two categories and a numeric measure.
Use one explained colour scale, distinguish missing from zero and keep the scale comparable across panels.
Takes: a table with two category columns and a value, such as hour by weekday, feature by segment or team by month, where colour carries the number.
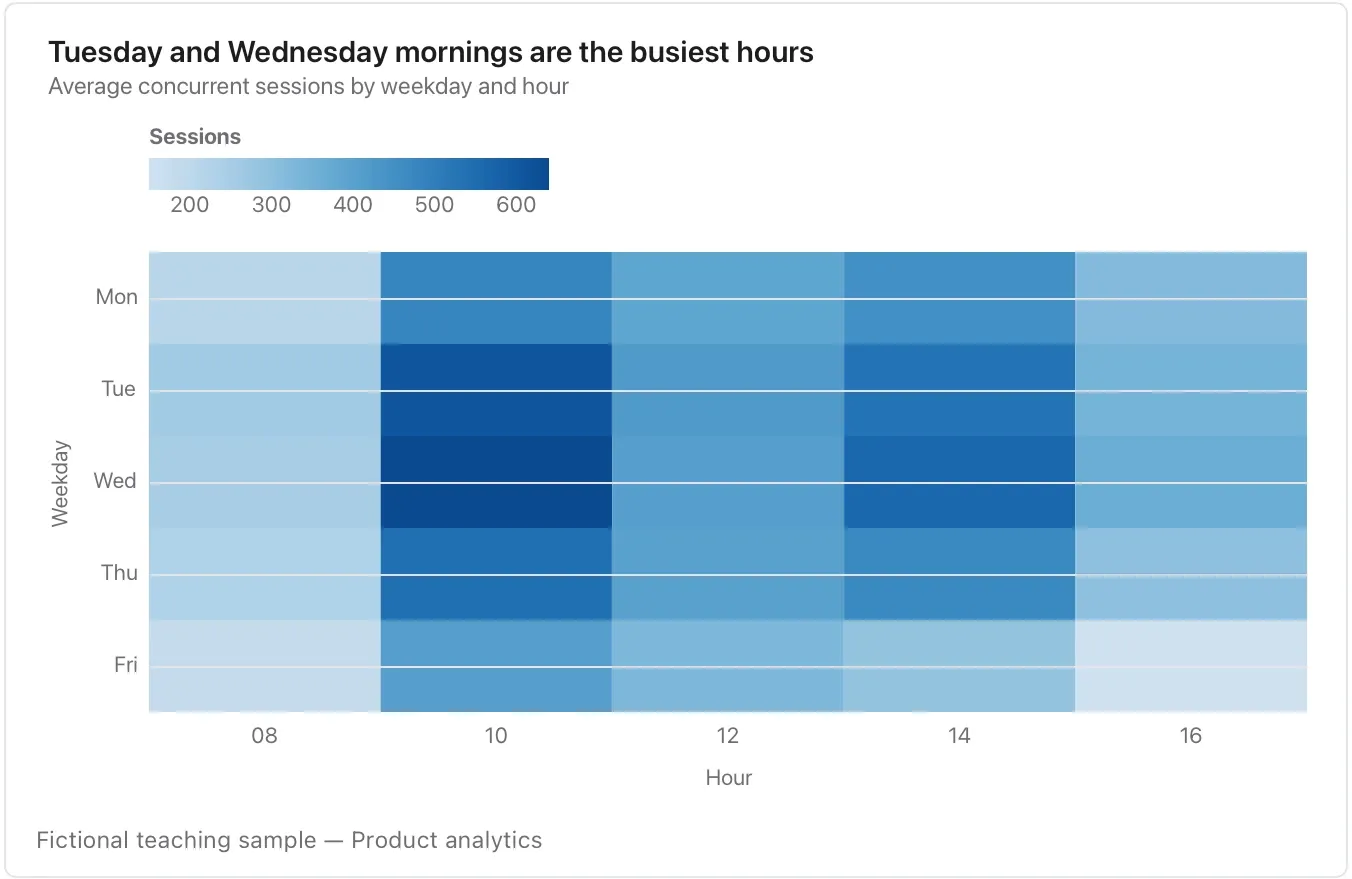
Chart and diagram kinds · Diagrams35 of 54
Flowchart
Explain steps and decisions, including the paths a person can take.
Treat arrows as an authored process; they do not execute an approval or send a message.
Takes: a numbered list of steps with decisions written as questions, such as a process, an approval path or a troubleshooting guide.
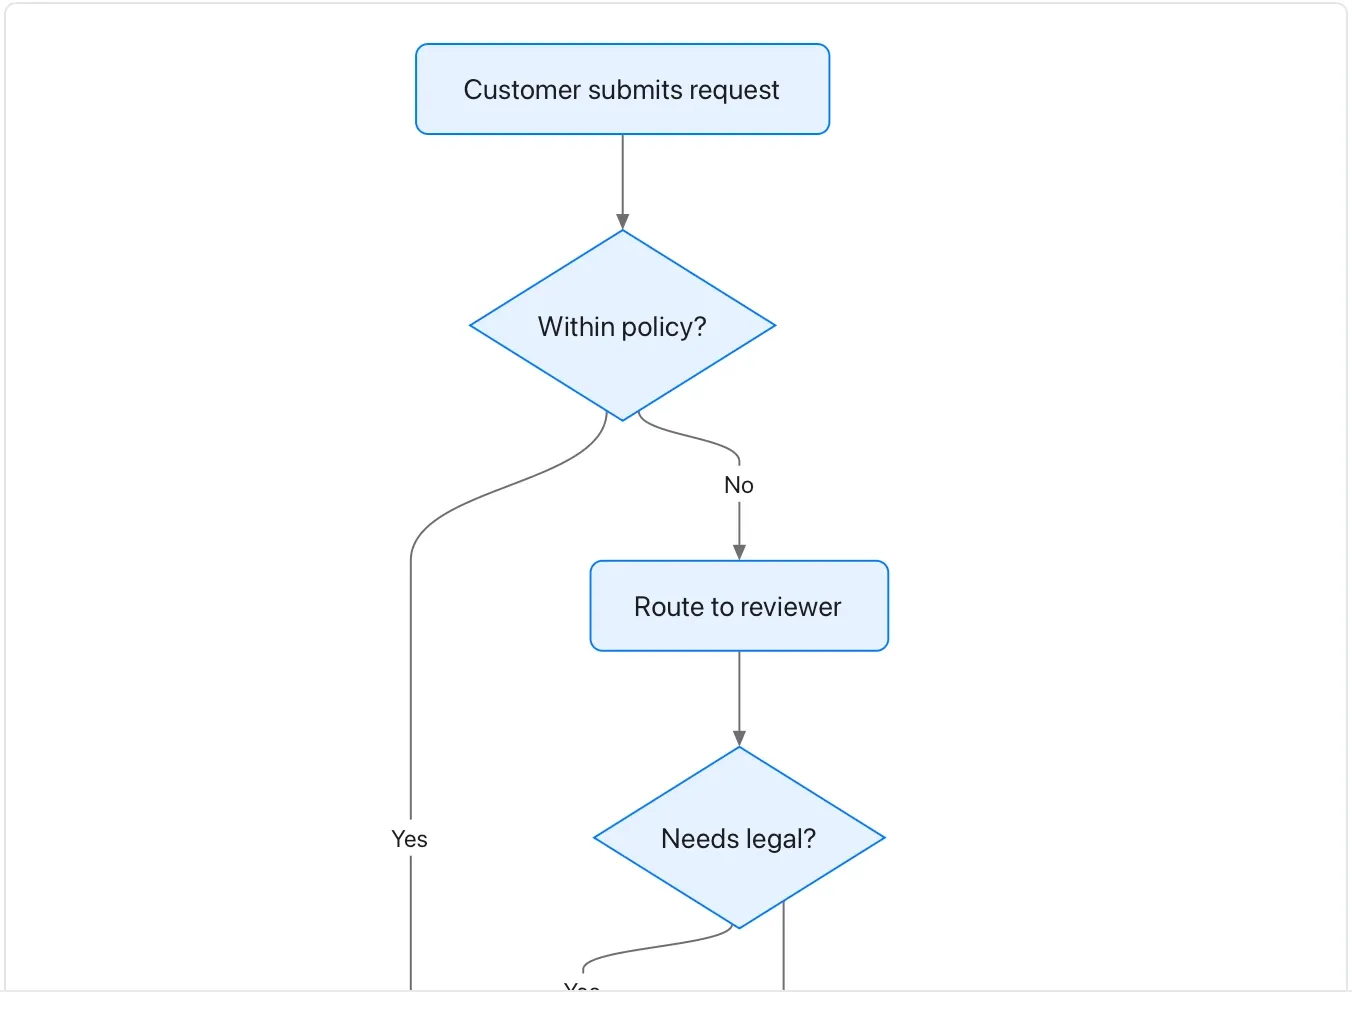
Chart and diagram kinds · Diagrams36 of 54
Sequence diagram
Show actors exchanging messages in order.
Name the boundary and failure path; the diagram is a scenario, not a trace captured from a live system.
Takes: prose or a list describing who sends what to whom, in order, such as an integration, a support escalation or an approval exchange between people or systems.
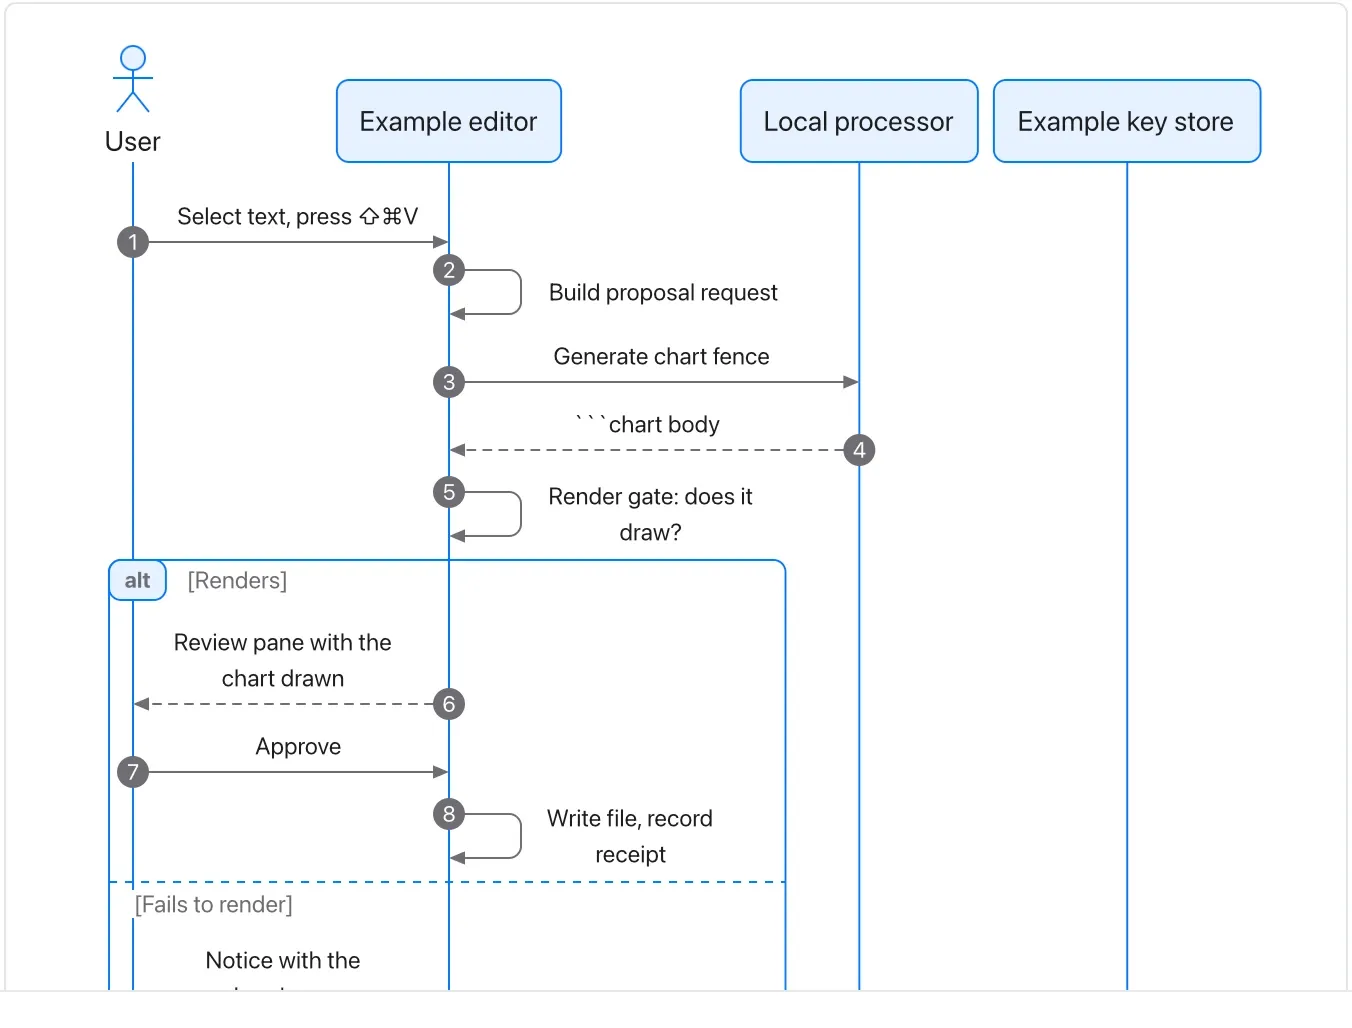
Chart and diagram kinds · Diagrams37 of 54
State diagram
Define allowed states and the events between them.
Keep state names distinct from actions and account for endings or reversals.
Takes: a list of states and the events that move between them, such as a document lifecycle, an order status or a subscription.
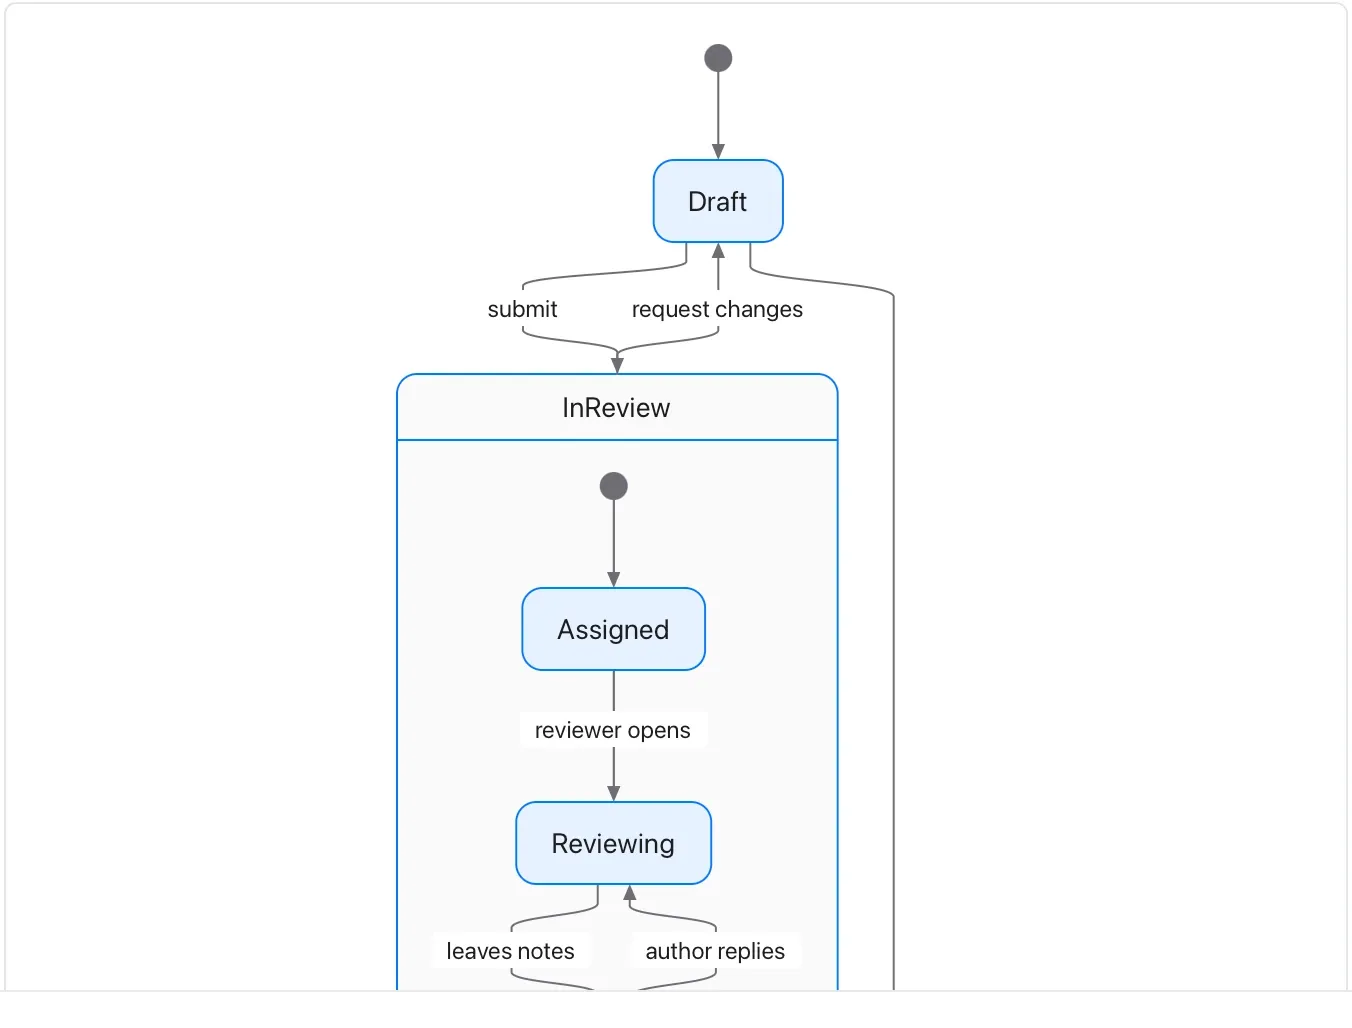
Chart and diagram kinds · Diagrams38 of 54
Class diagram
Describe conceptual entities, their fields and relationships.
Multiplicity and ownership should have a defined meaning; this is an illustrative model, not Flow source code.
Takes: a description of the nouns in a system and how they relate, such as the data model behind a product, with fields and one-to-many relationships.
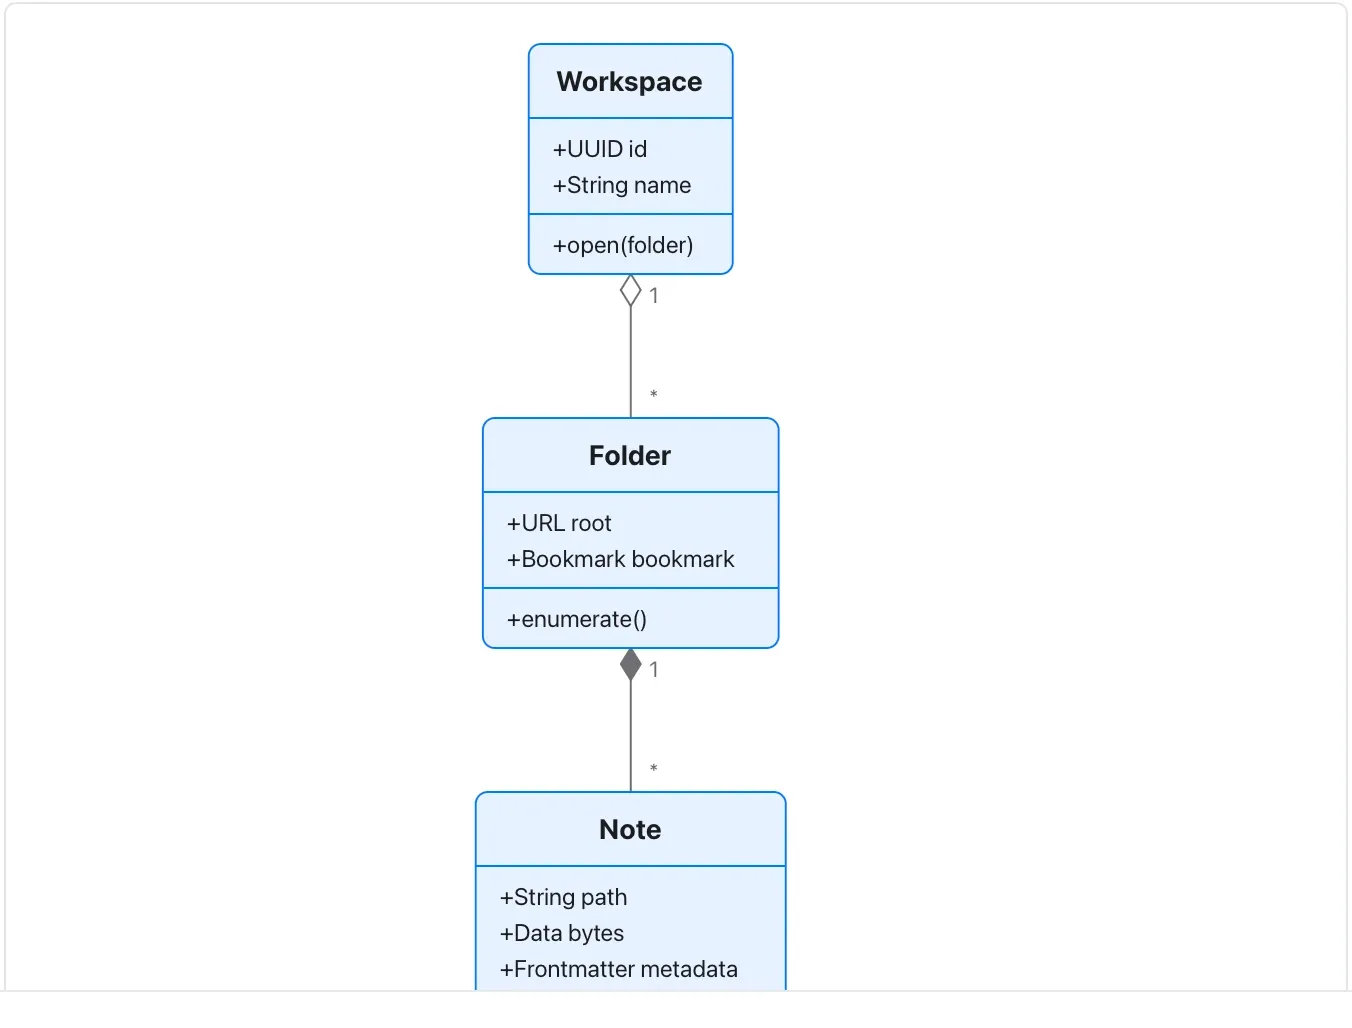
Chart and diagram kinds · Diagrams39 of 54
Entity-relationship diagram
Describe records, keys and relationships.
Confirm cardinality with the data owner; a diagram is not a database migration.
Takes: a list of tables with their keys and how rows reference one another, such as a database schema or a CRM’s objects.
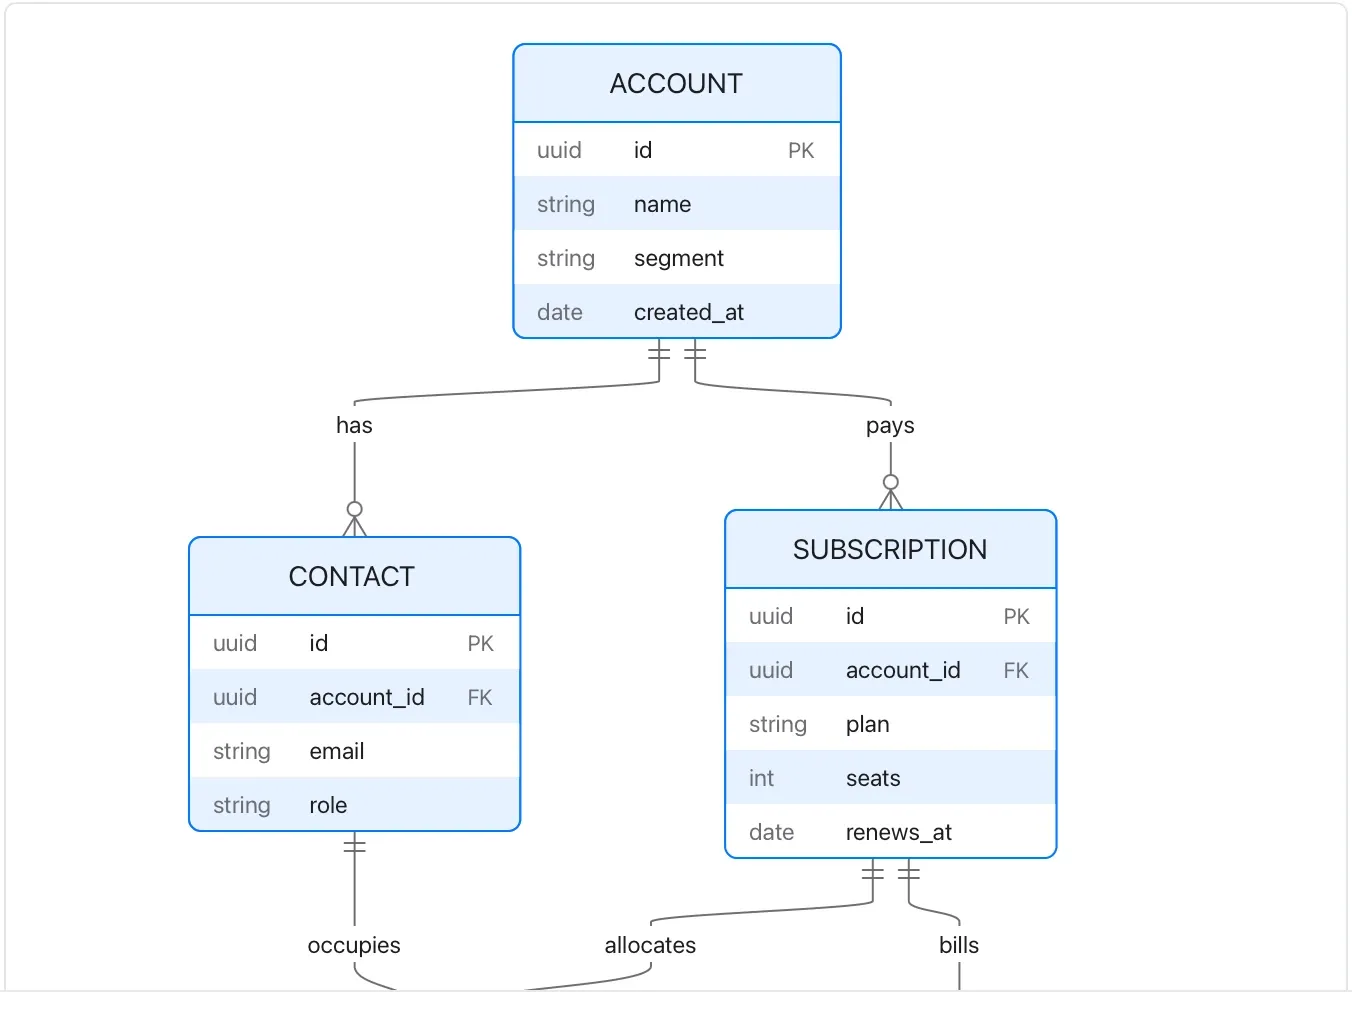
Chart and diagram kinds · Diagrams40 of 54
Gantt (diagram)
Write a dependency-oriented schedule as text.
This example is separate from the chart Gantt; neither proves a planned task completed.
Takes: a list of tasks with durations and dependencies, in sections. That fits a project plan written as prose, when you want milestones and “after X” dependencies rather than fixed dates.
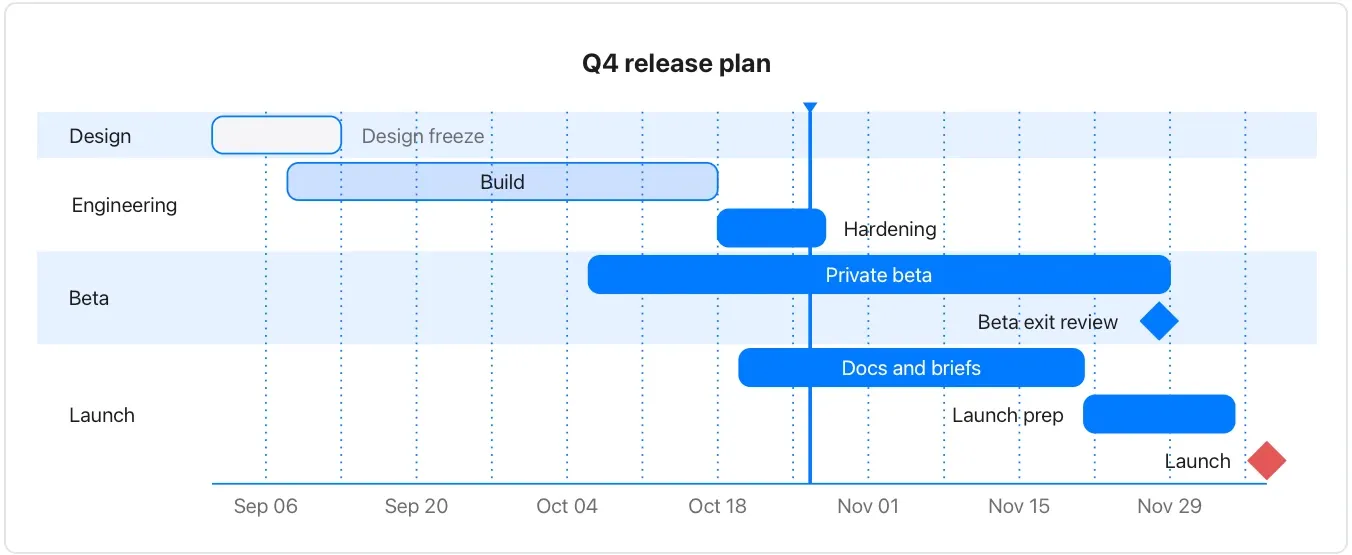
Chart and diagram kinds · Diagrams41 of 54
User journey
Summarize a sequence of tasks and an explicitly subjective experience rating.
Say whose experience the ratings describe; this sample is not a user-research result.
Takes: a walkthrough of what a person does, step by step, with how each step felt, such as research synthesis, a support transcript or an onboarding review.
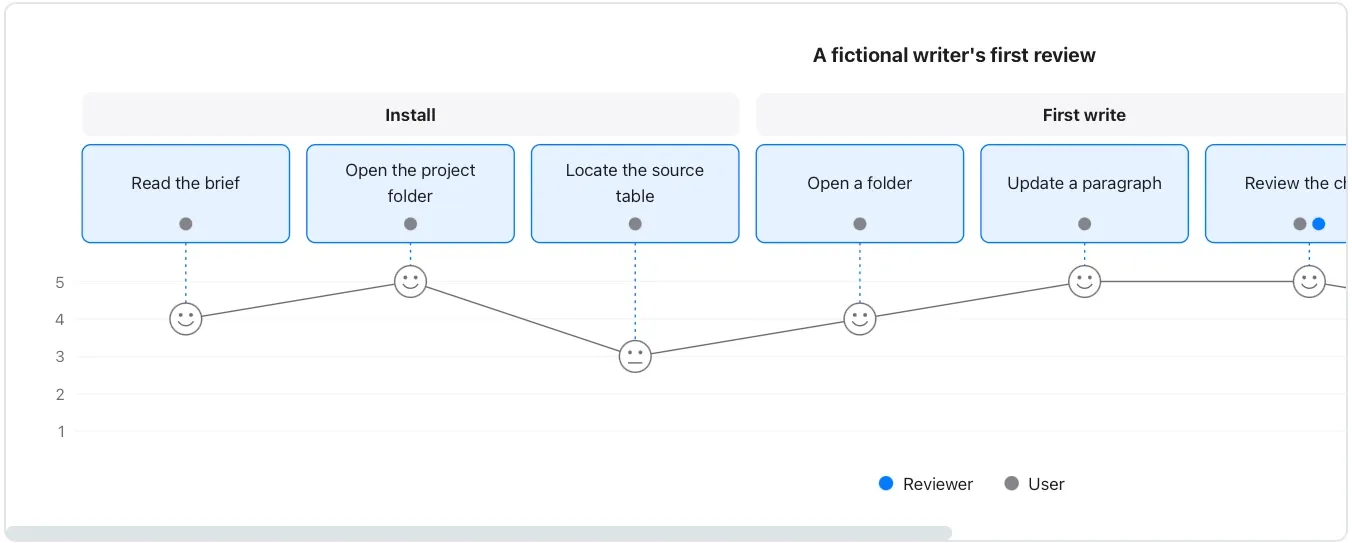
Chart and diagram kinds · Diagrams42 of 54
Pie (diagram)
Show a few embedded amounts within a diagram.
It is authored data; the chart-fence pie is the choice here when values must bind to a local source.
Takes: a short list of labels and amounts. It is the same material as a chart pie, when you want it inside a diagram-only document or rendered on GitHub.
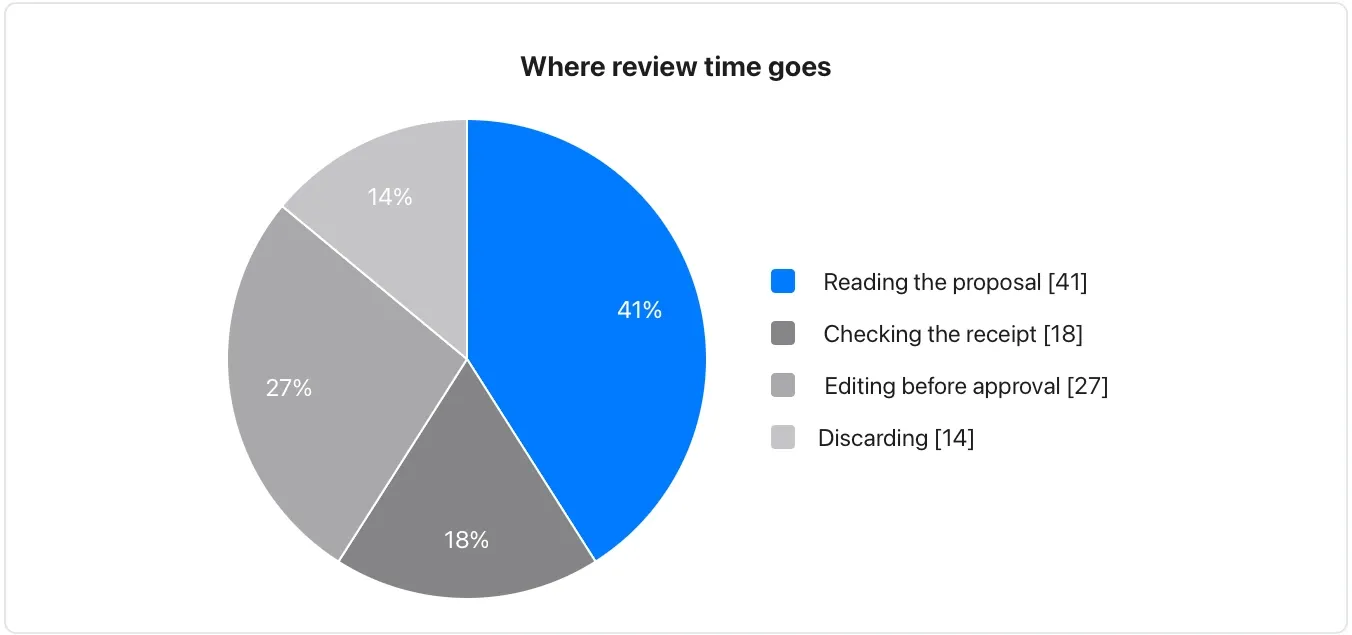
Chart and diagram kinds · Diagrams43 of 54
Quadrant chart
Discuss items scored on two explicit axes.
The placement is a judgment to review; a quadrant label is not a prioritization algorithm.
Takes: a list of items each rated on two axes, such as effort and impact, risk and reward or urgency and importance, the prioritisation matrix.
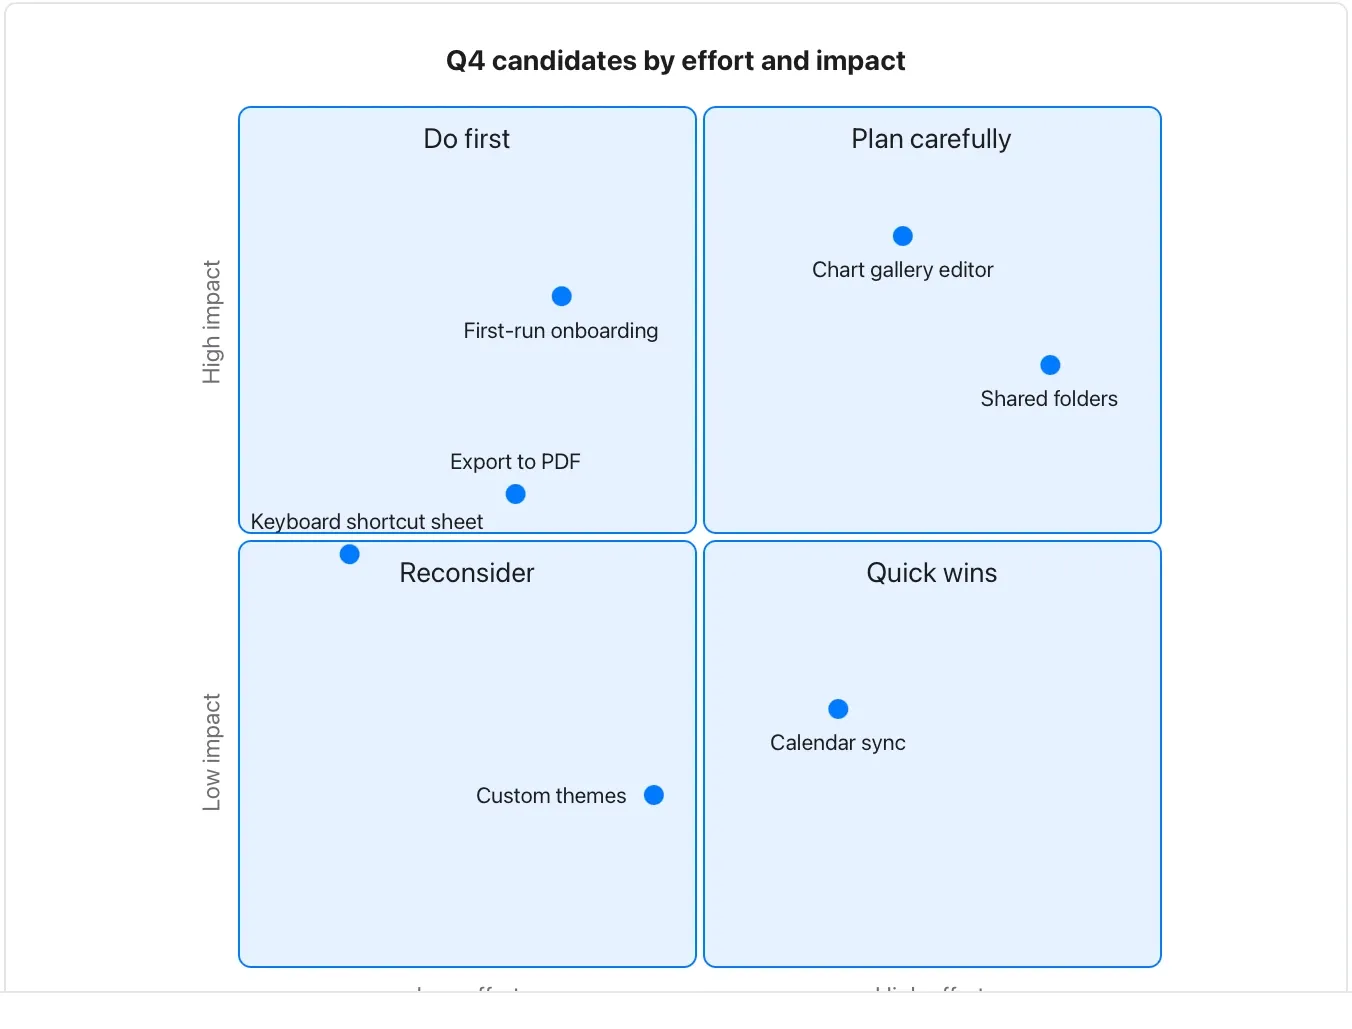
Chart and diagram kinds · Diagrams44 of 54
Timeline
Present dated milestones in order.
Distinguish planned dates from observed events and do not treat this fictional history as a Flow release record.
Takes: a list of dated events, such as a company history, a release log or an incident’s sequence.
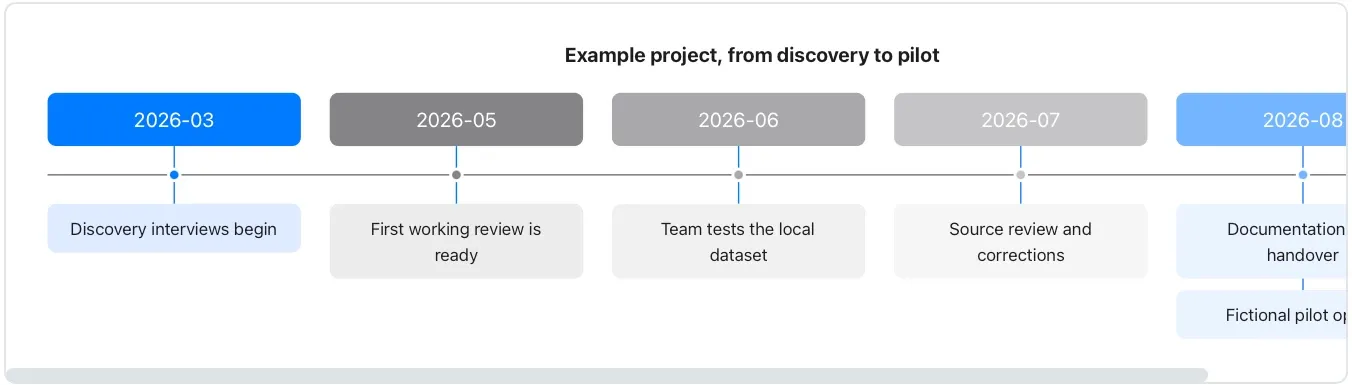
Chart and diagram kinds · Diagrams45 of 54
Mindmap
Turn a nested outline into a navigable conceptual structure.
Branches are authored associations, not an automatically maintained knowledge graph.
Takes: an outline, a nested bulleted list of topics and subtopics, such as meeting notes, a brainstorm, or a document’s structure.
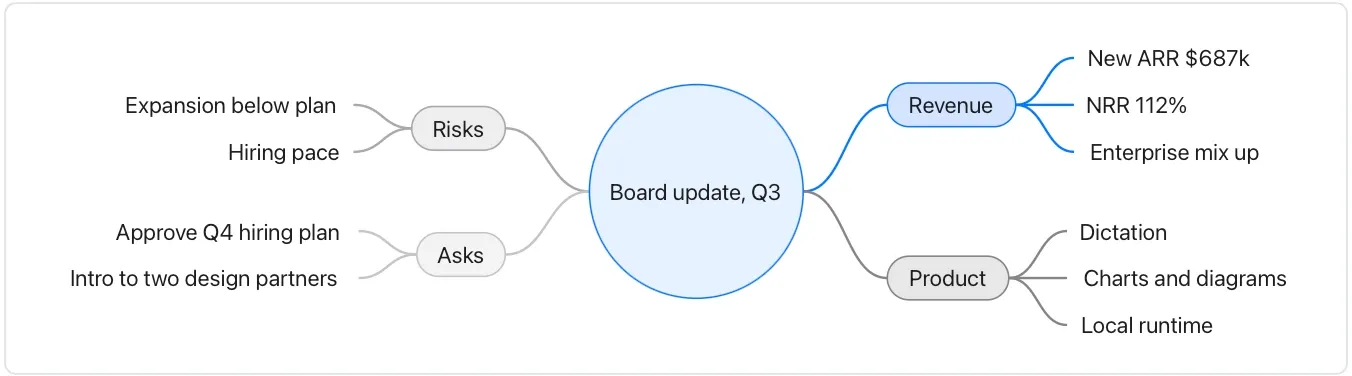
Chart and diagram kinds · Diagrams46 of 54
Git graph
Explain a small branch-and-merge history.
The commits below are fictional labels; the diagram does not inspect or operate a repository.
Takes: a description of branches, merges and releases, such as a release process or how a feature landed.
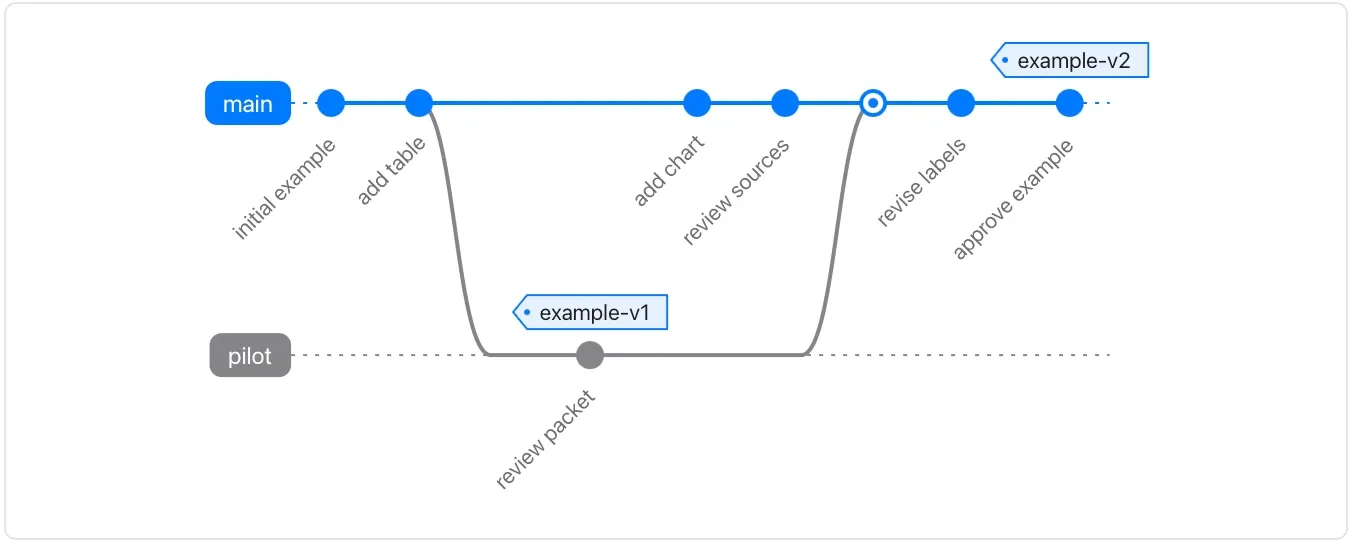
Chart and diagram kinds · Diagrams47 of 54
Sankey diagram
Follow amounts between named stages.
Check units and flow conservation; these numbers are embedded in the diagram and do not update from a source table.
Takes: a table of source, target and amount. It shows where traffic, money or people flow from one stage to the next, such as a funnel or an energy balance.
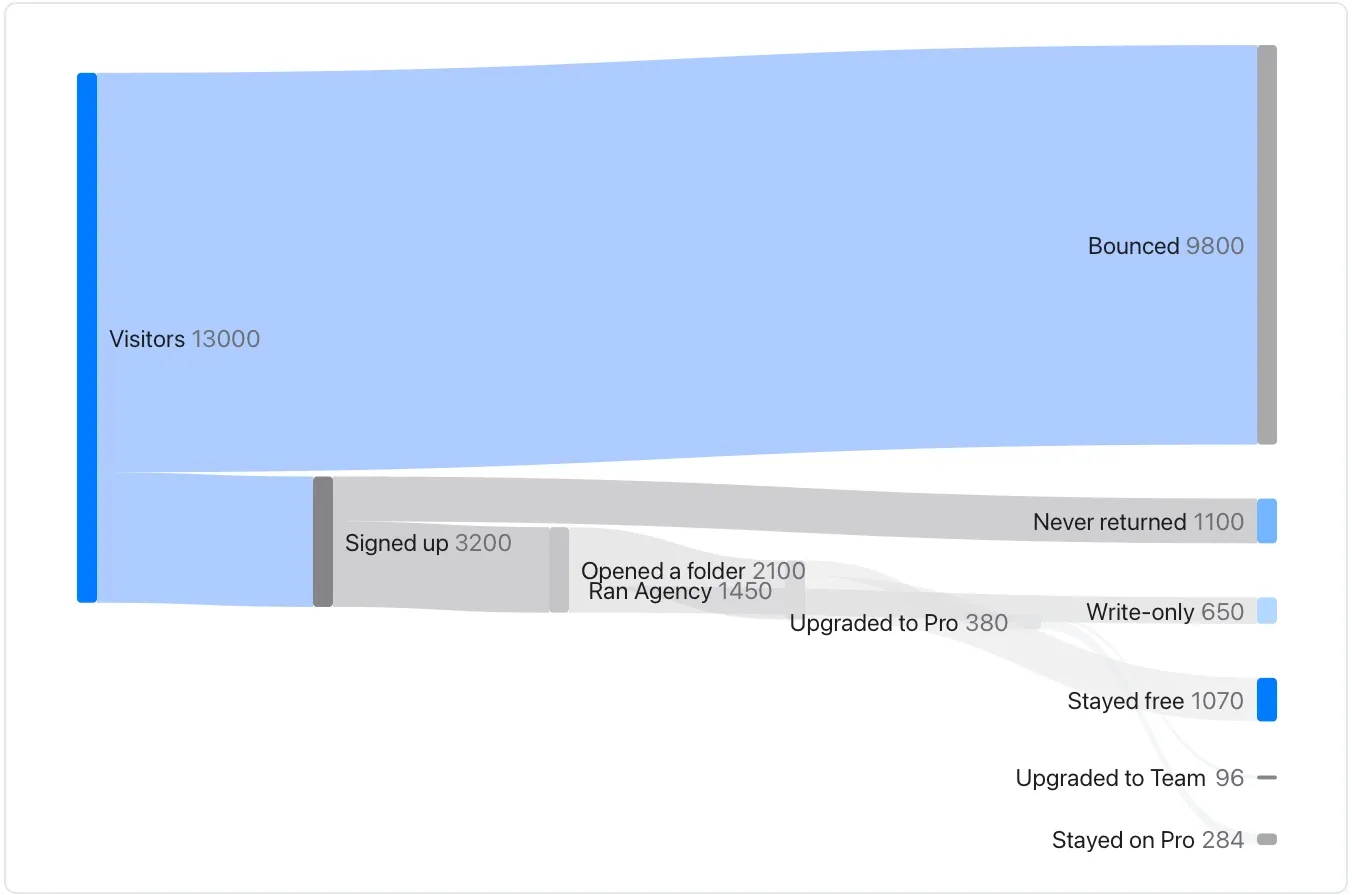
Chart and diagram kinds · Diagrams48 of 54
XY chart (diagram)
Combine simple embedded bar and line series using one explained axis.
Keep units compatible and identify each series in the surrounding prose.
Takes: a date-and-value table when the document must render on GitHub as well as in Flow. It draws a bar-plus-line over months without the chart fence. Bars show signups; the line shows activated accounts. Both use account counts, not percentages.
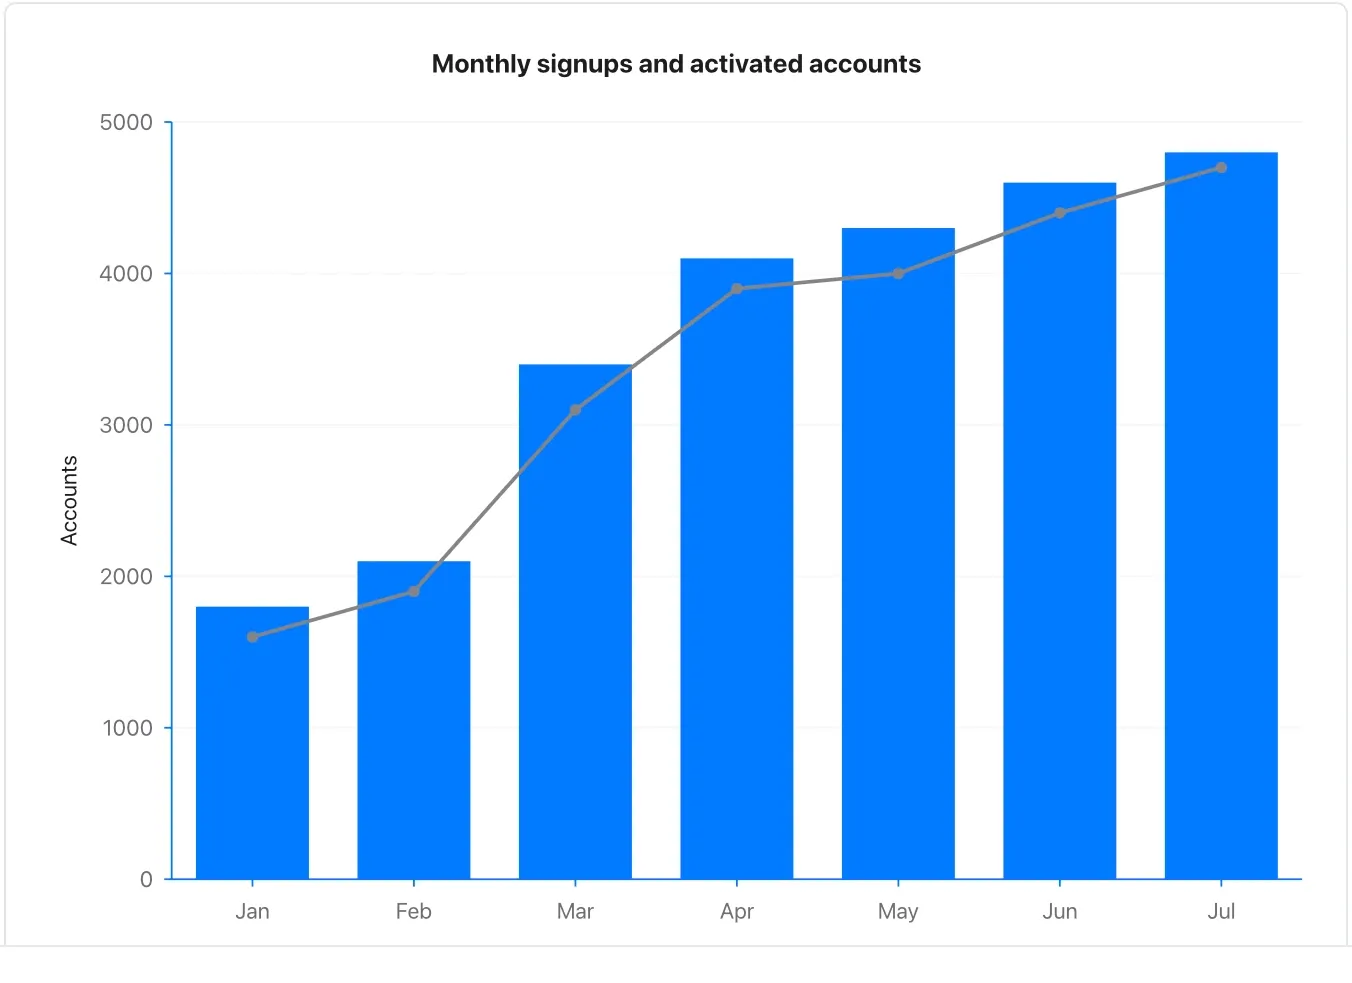
Chart and diagram kinds · Diagrams49 of 54
Block diagram
Arrange a small set of components to explain responsibilities.
Keep arrows labelled or obvious and avoid implying that visual proximity is a connection.
Takes: a description of components and how they sit beside and connect to each other, such as an architecture sketch or a deployment layout.
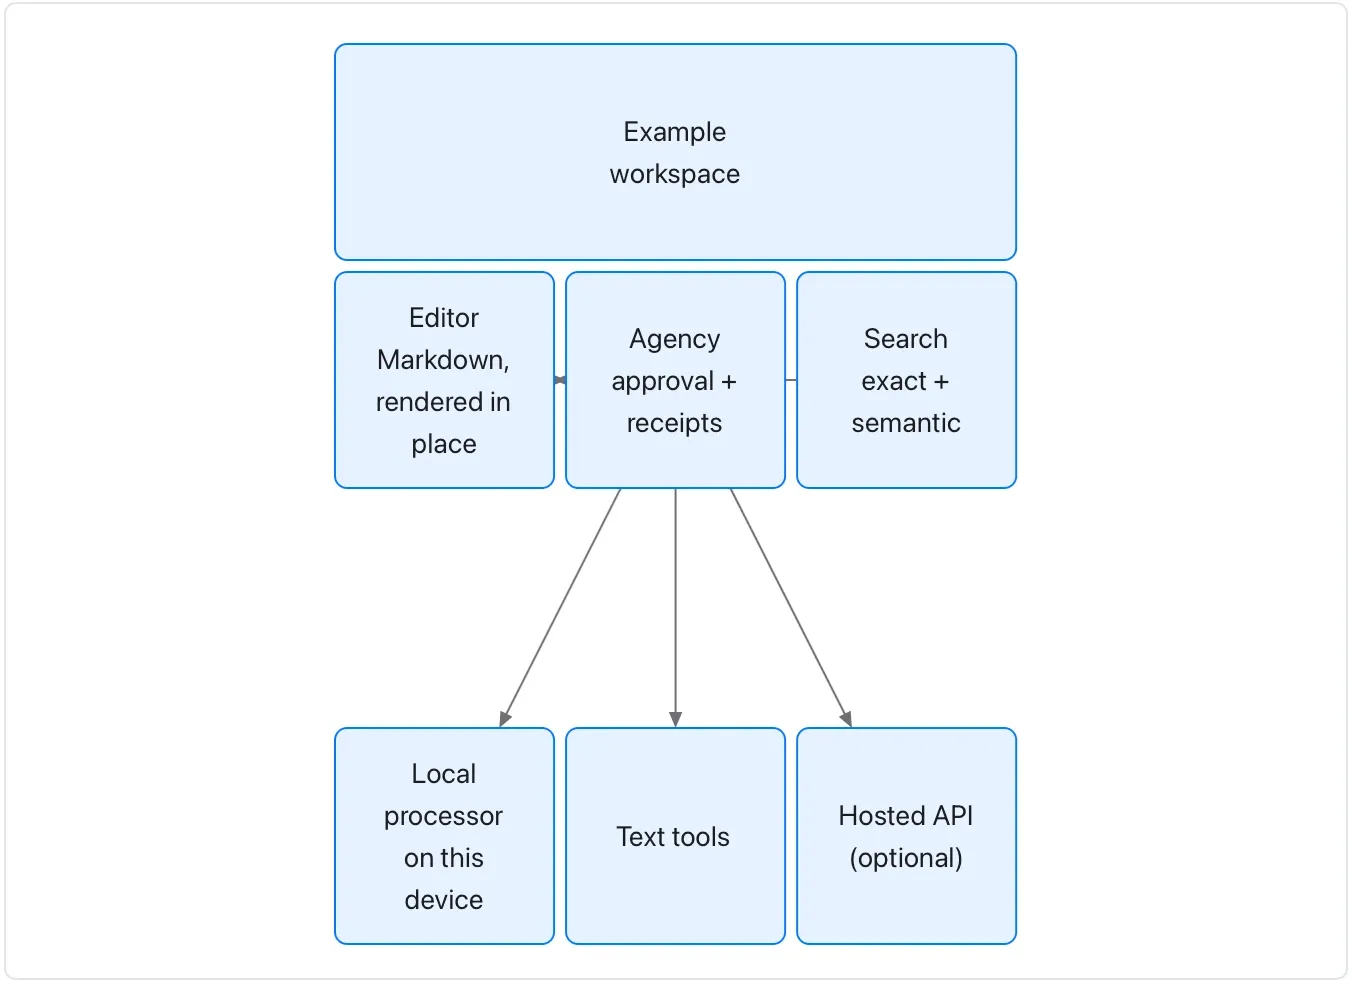
Chart and diagram kinds · Diagrams50 of 54
Requirement diagram
Connect an authored requirement to its proposed verification and components.
A satisfies arrow records an assertion, not completed compliance or test evidence.
Takes: a list of requirements with identifiers, risk and verification method, and which components satisfy them. That fits a compliance or safety document. These are fictional requirements and components, not verified Flow guarantees.
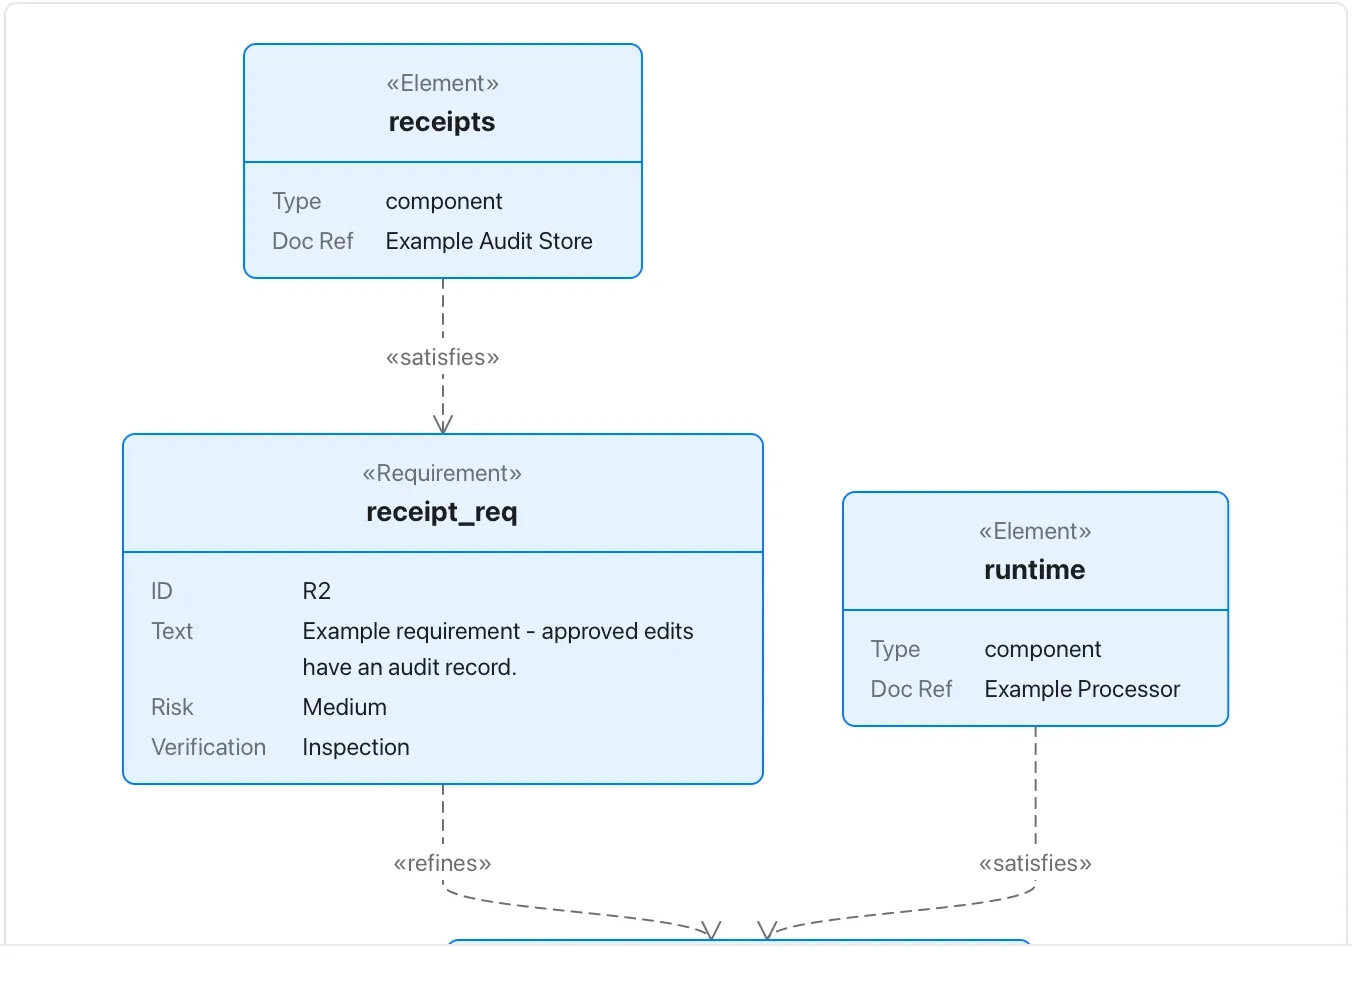
Chart and diagram kinds · Diagrams51 of 54
C4 context diagram
Show people, a system and its external neighbours.
Keep the level of detail consistent and state the system boundary before drilling into components.
Takes: a paragraph naming the system, the people who use it, and the external systems it talks to. That is the top of an architecture document.
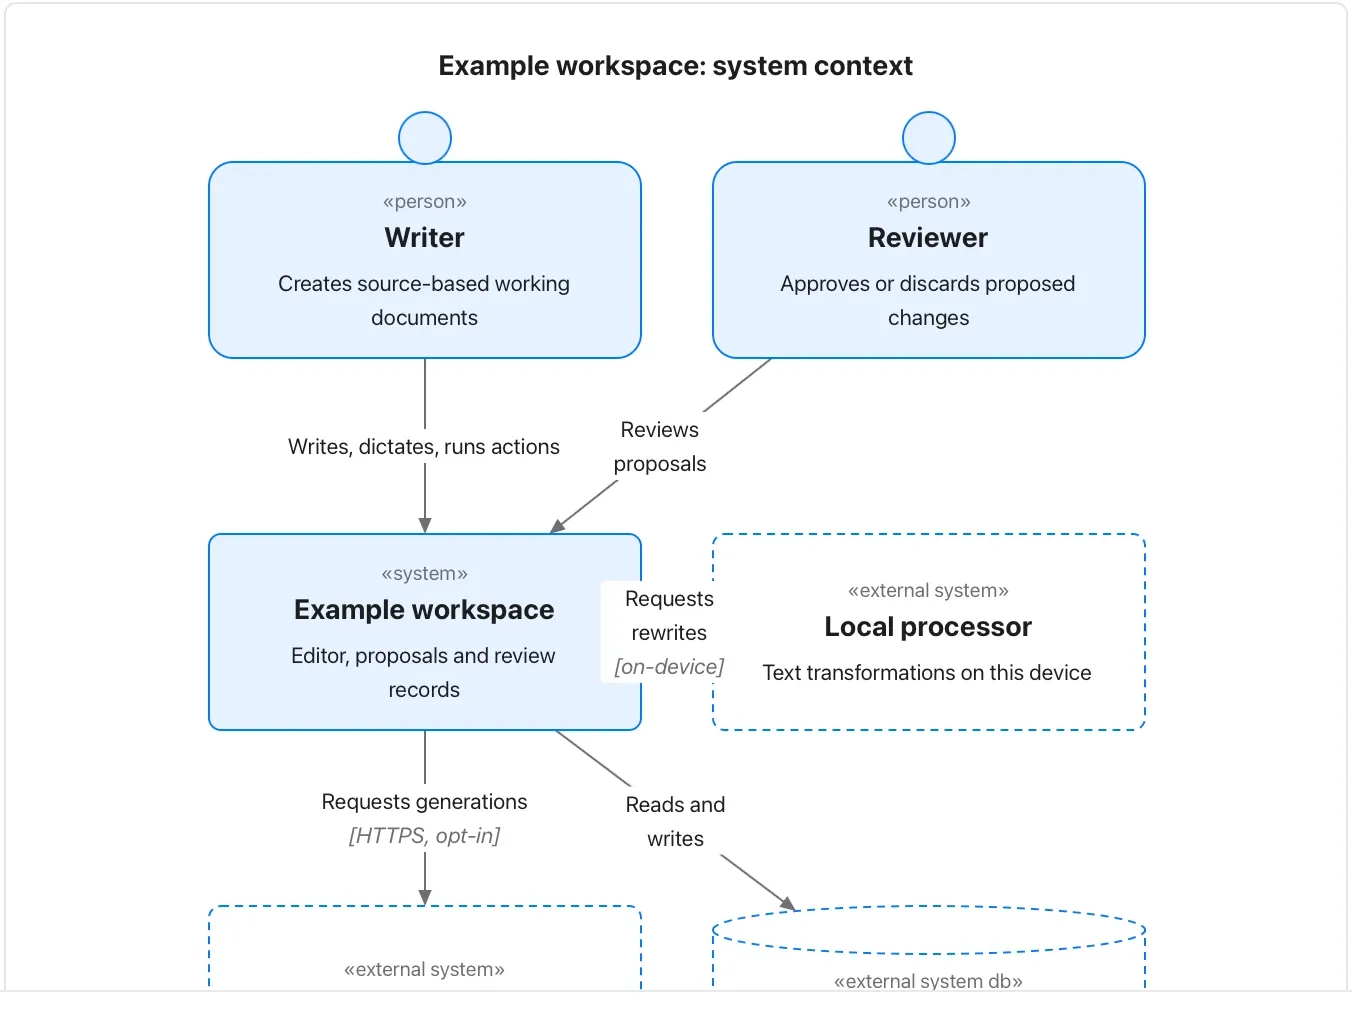
Chart and diagram kinds · Diagrams52 of 54
Kanban board
Group an authored task list by status.
Moving a card in text changes this document; it does not update an external project-management system.
Takes: a task list grouped by status. That is the sprint board as columns of cards with owners.
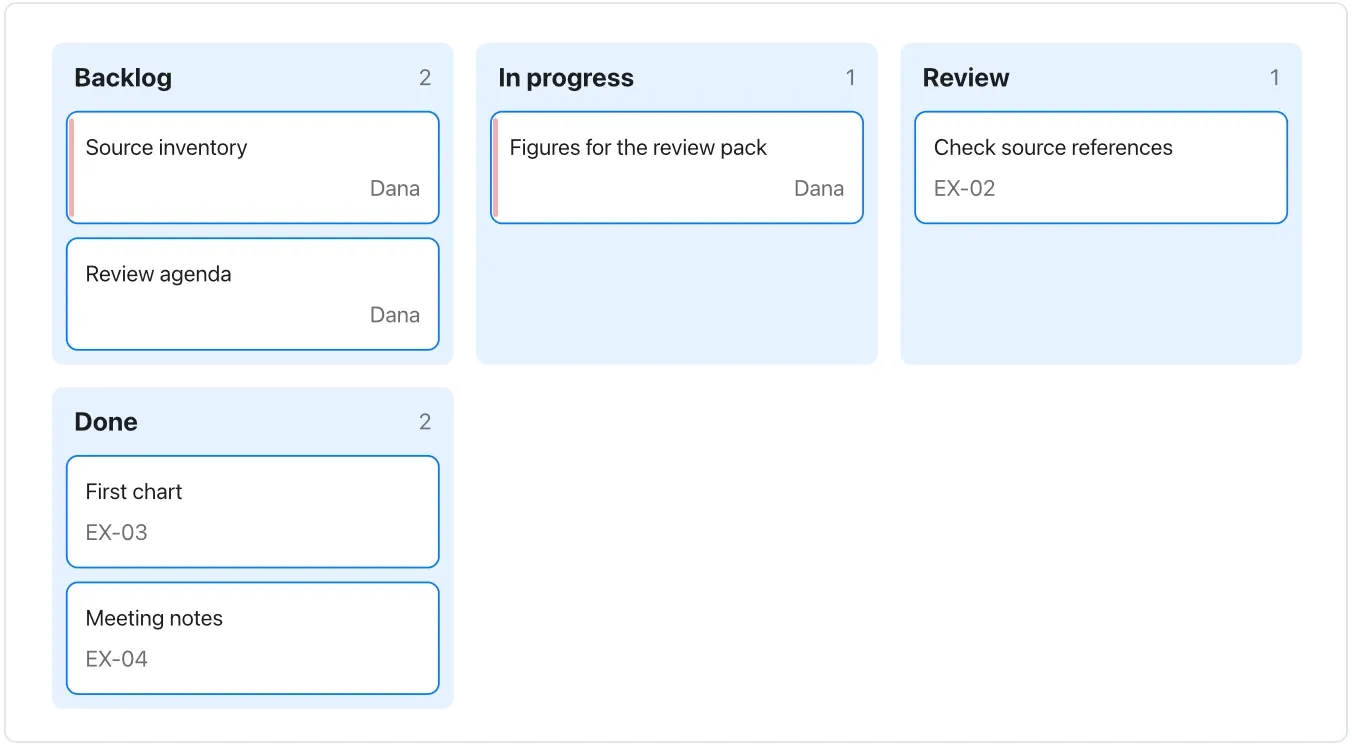
Chart and diagram kinds · Diagrams53 of 54
Architecture diagram
Describe services, stores and deployment groups.
The picture records an intended arrangement; it neither provisions infrastructure nor proves a privacy boundary.
Takes: a list of services, the stores they use and the edges between them, grouped by where they run. That is a deployment diagram.
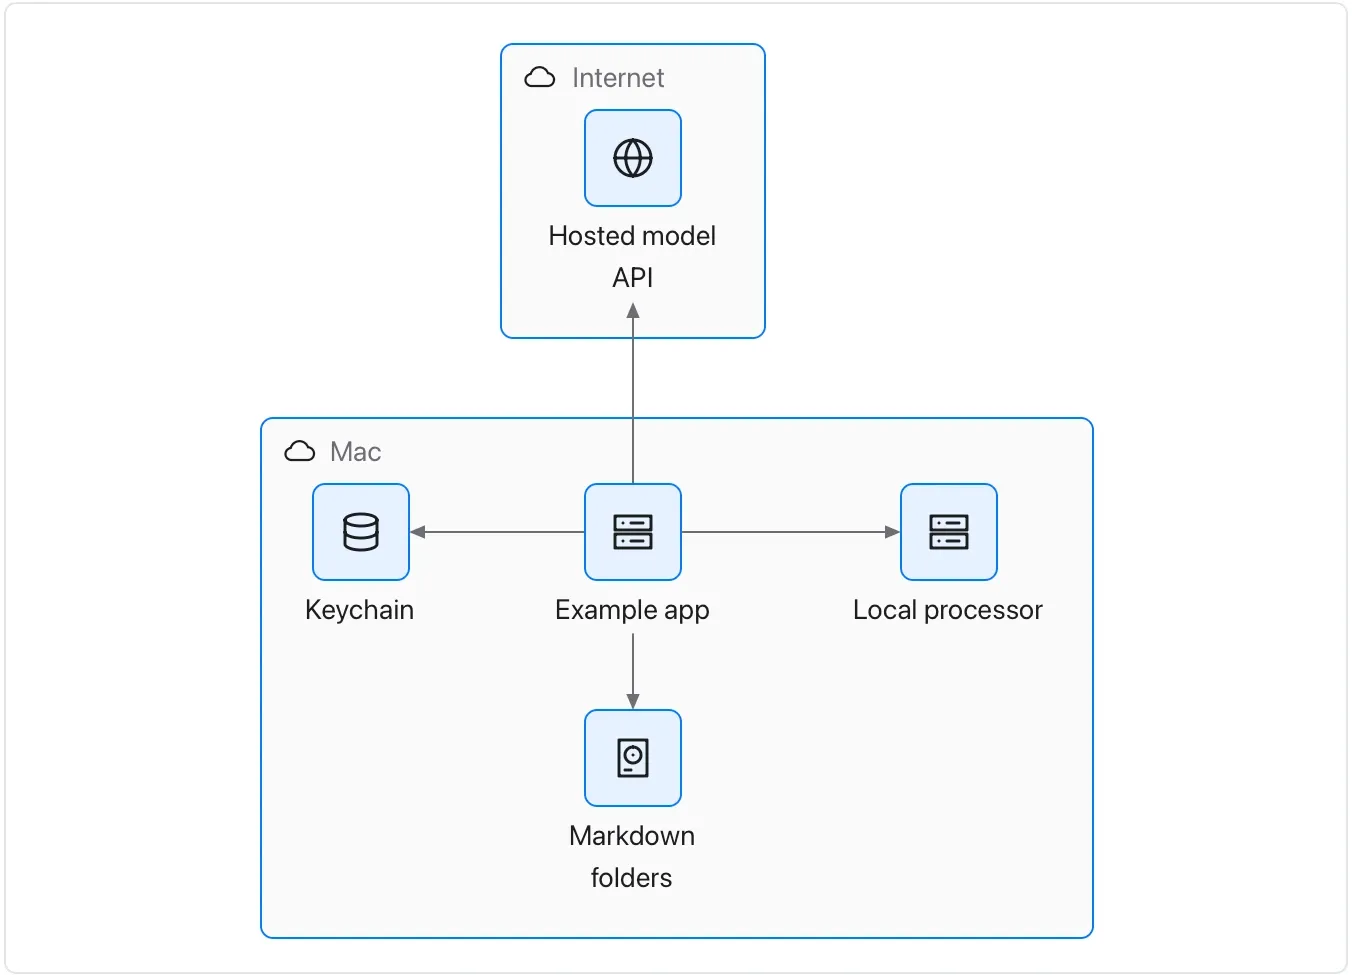
Chart and diagram kinds · Diagrams54 of 54
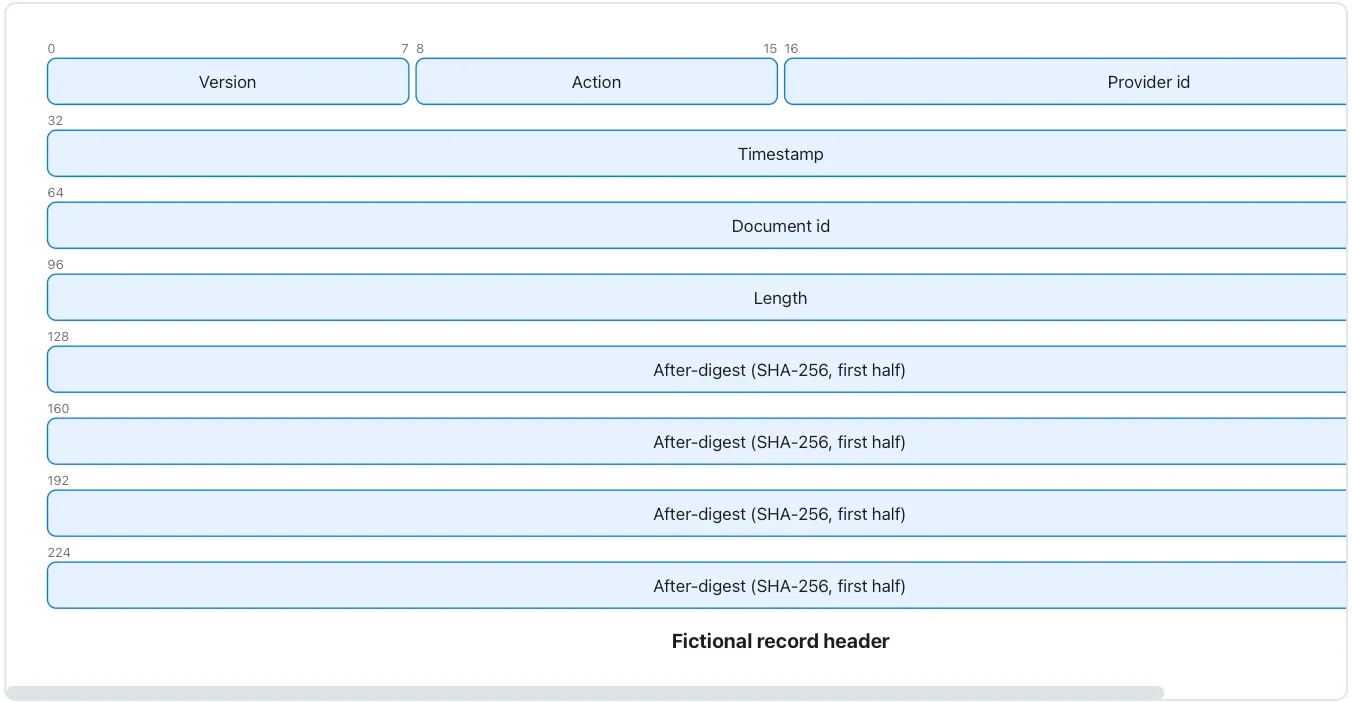
Packet diagram
Describe the bit layout of a fictional binary header.
State field widths and total size; do not use this sample as an actual Flow file-format specification.
Takes: a field-by-field layout of a binary record or header, with bit offsets, such as a protocol note or a file-format spec.
Open a chart in Flow and the Elements panel turns into a catalogue of every kind Flow draws: 34 chart kinds in four groups named for the question each answers, and 20 diagram kinds when the open block is a diagram. Each card has a drawing of its shape and one line, and the kind on screen carries a check. In this walk a bar chart became a lollipop chart in one press with its data kept. A candlestick, which this data can't make, was refused with a sentence saying what it needs. No model is involved. The switch happens on your Mac at once.
What Flow does
Every chart Flow can draw is one press away, and Flow tells you which ones your data can make. Open any chart or diagram in Orionfold Flow and the sidebar’s Elements panel lists the kinds by question: Comparison and ranking, Change over time, Composition and flow, Distribution and relationship, and Diagrams. Each card shows the shape, says what the kind shows, and, when you rest on it, what data gets you there. Press a kind and the chart redraws with your data kept. If your data can’t take that kind, the chart stays as it was, and the card and the editor say what the kind needs. You can start from Flow’s example, or keep yours. Format ▸ Chart Type lists the same kinds for the keyboard.
The answer first
- Open a chart or diagram in its editor: hover it in the document and press Open in the gallery, or insert one from Elements ▸ Chart.
- Press ⌘5. Elements lists the kinds for that block, grouped by question, with the current one checked.
- Rest the pointer on a kind, or reach it with the arrow keys, to read what data it takes.
- Press it (or Return). The chart redraws with your data. Press Apply to keep it or Revert to go back.
- If the kind can’t use your data, the card says Your data doesn’t fit it, and the editor names what the kind needs and offers Start from the example or Keep mine.
The job
A table of numbers can become a dozen pictures, and most of them mislead. Bars where a line belongs hide the trend. A pie with nine slices hides the shares. A histogram of three values shows nothing. Choosing well means knowing what each kind is for and what shape of data it expects. That knowledge usually lives in a style guide nobody opens. Flow puts it on the card, next to the chart.
Switch, with your data kept
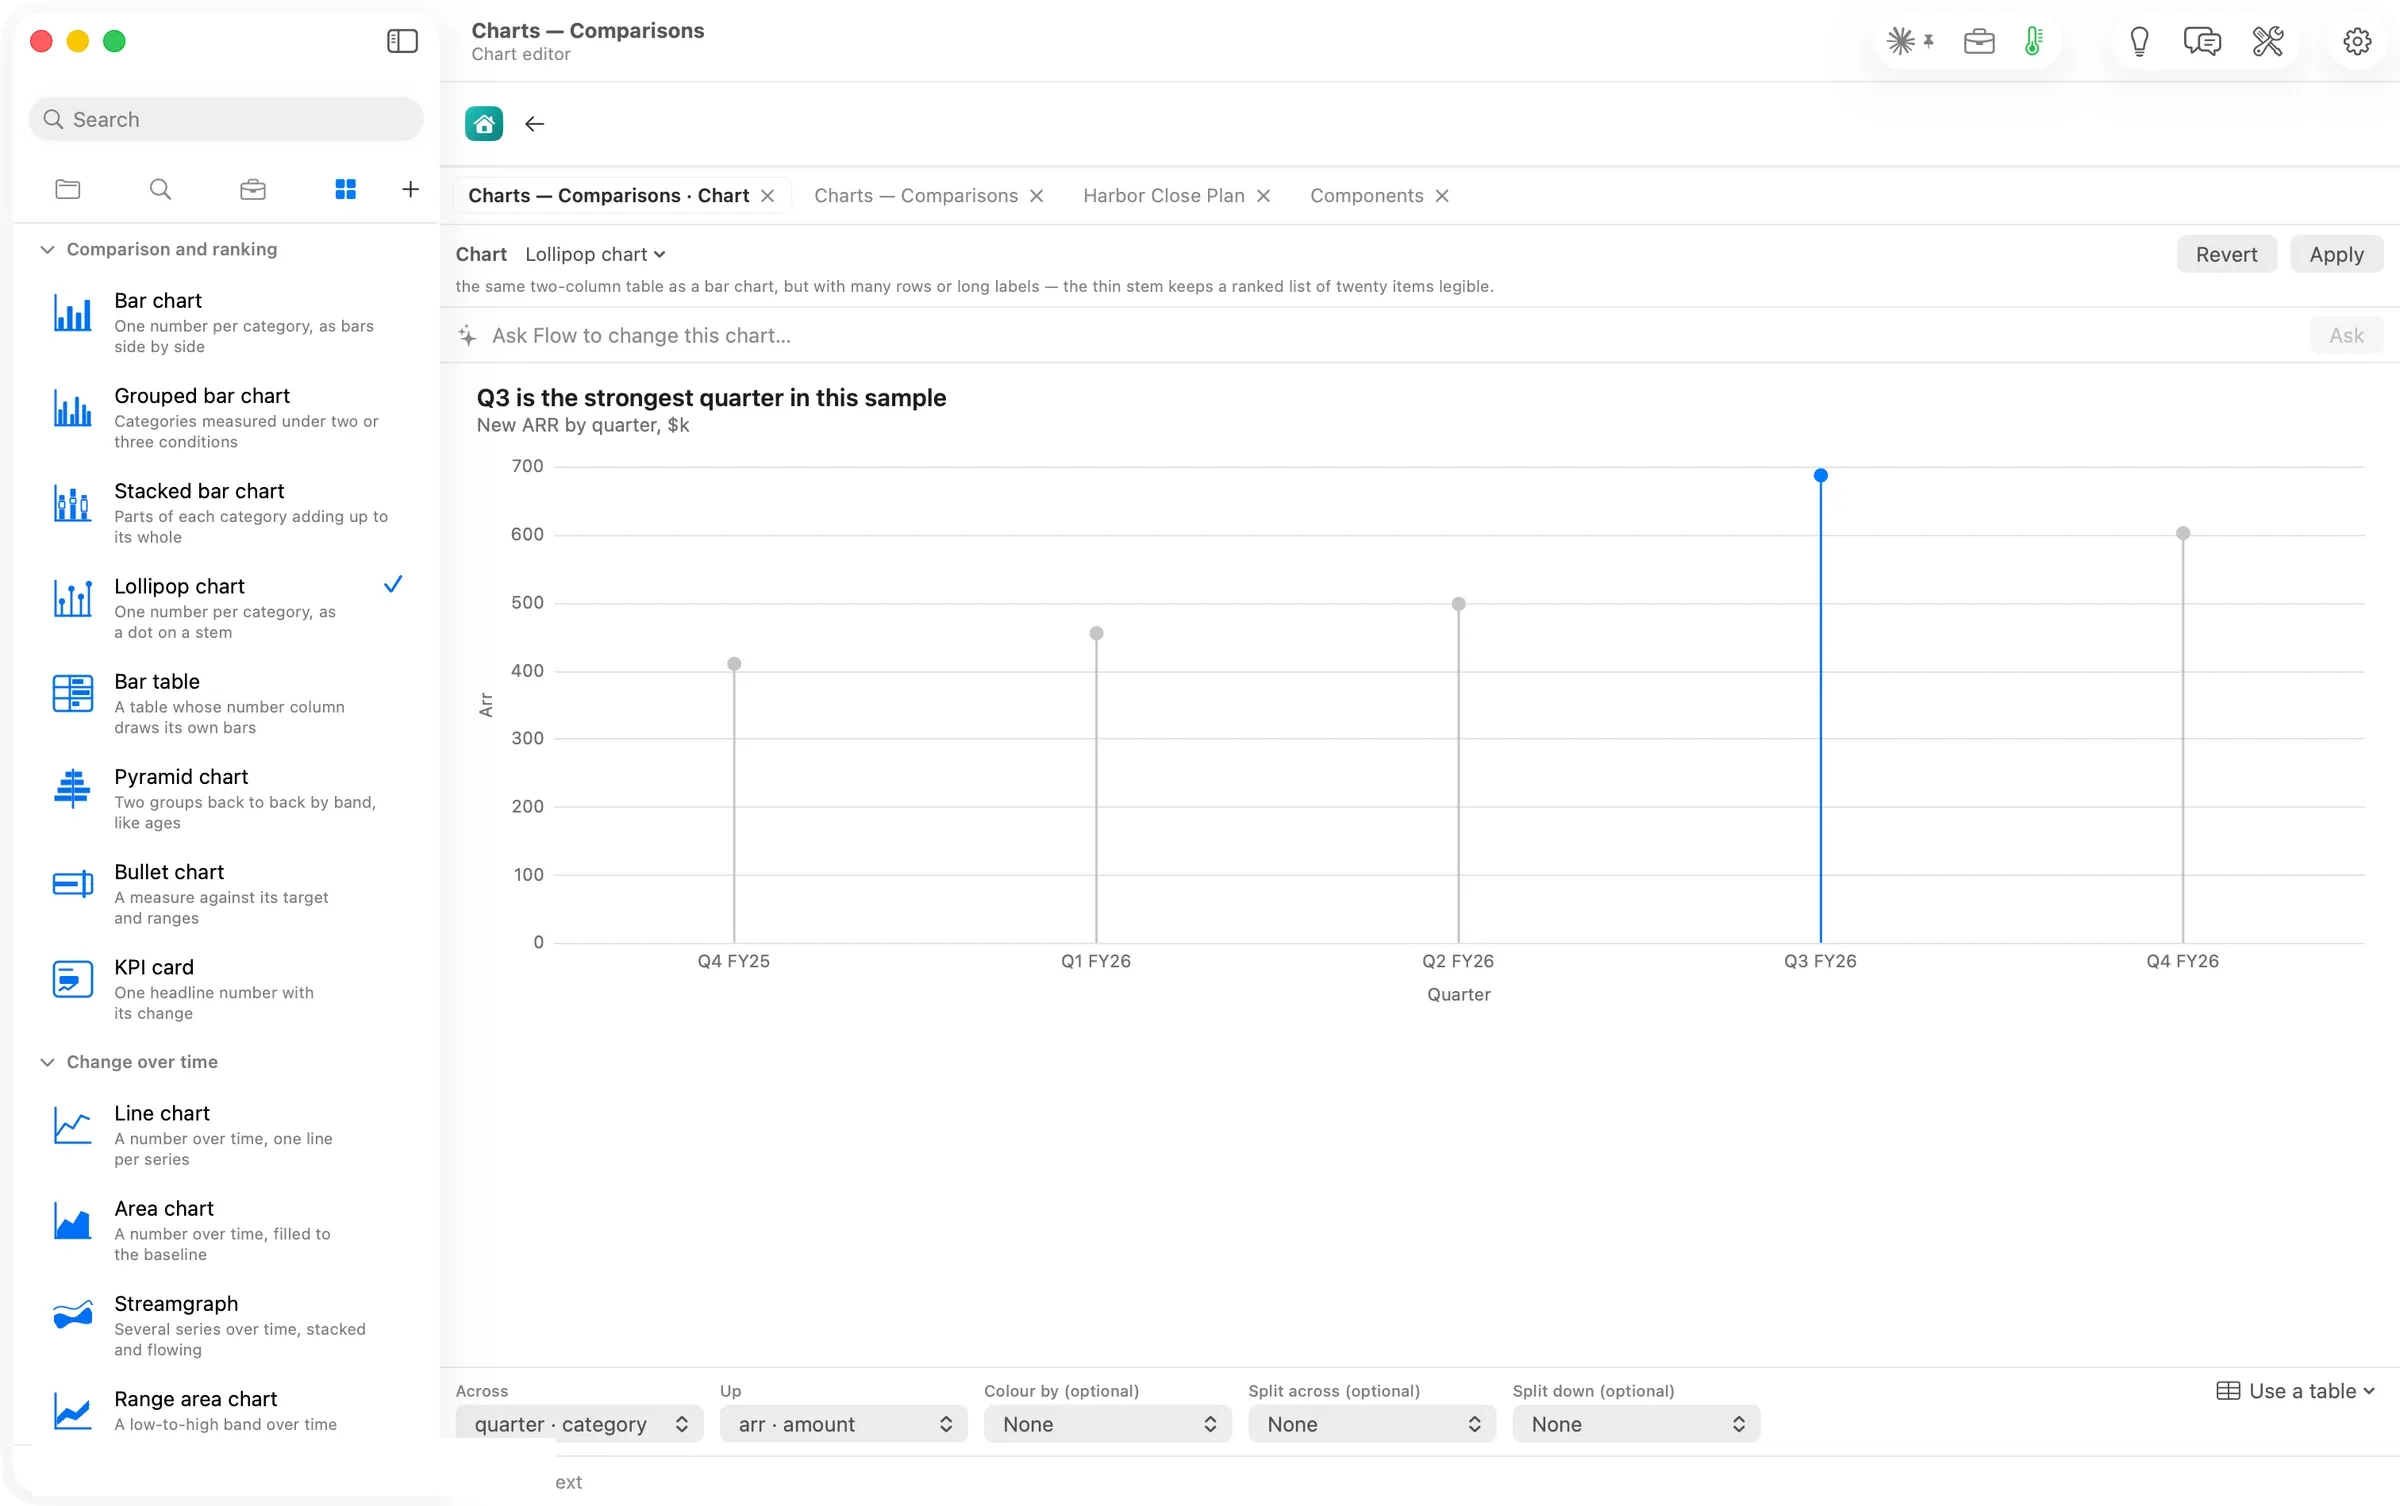
Pressing Lollipop chart redrew the five quarters as stems and dots, Q3 still in the accent colour. The check moved, and the editor’s header changed to the new kind’s need. It wanted the same two-column table as a bar chart, but with many rows or long labels.
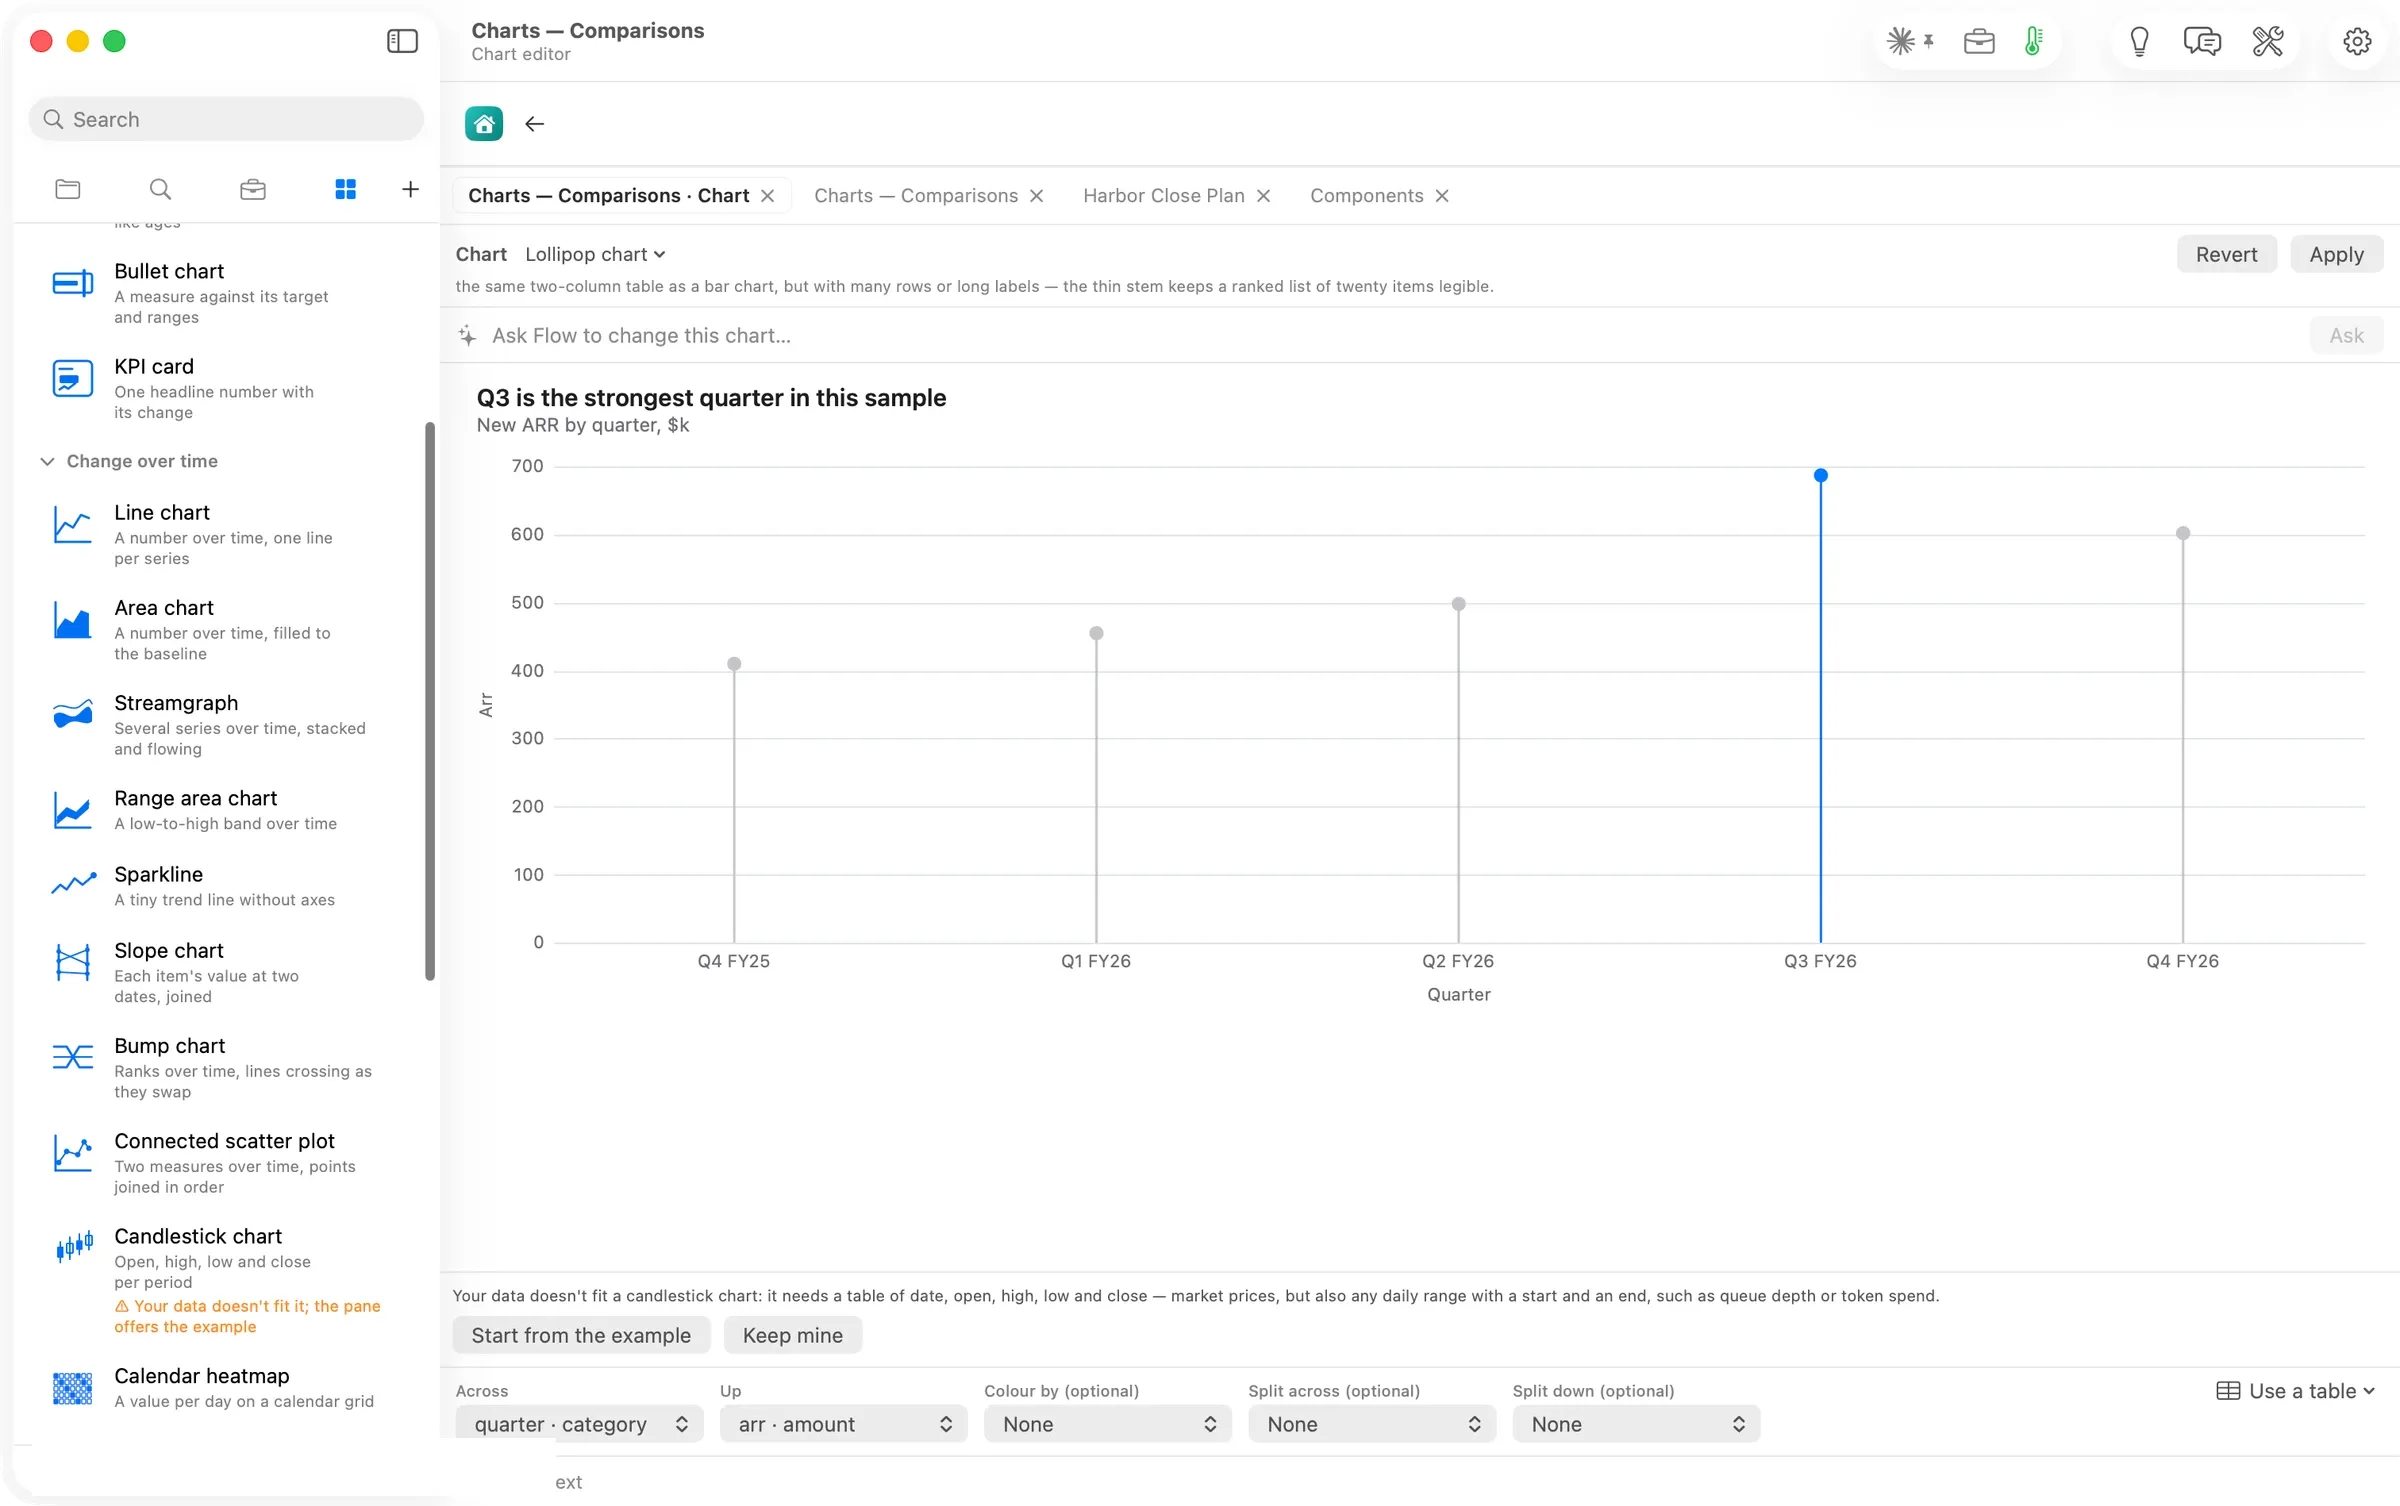
Pressing Candlestick chart on the same data changed nothing. The card turned orange, Your data doesn’t fit it; the pane offers the example, and the editor said exactly why. It needs a table of date, open, high, low and close. Keep mine and Revert left the file as it was; read back afterwards, it was byte for byte the Guide’s original.
The numbers
| Figure | Value | Status and source |
|---|---|---|
| Chart kinds, with a chart open | 34, in four groups (8, 10, 6, 10) | verified: the panel’s list, read 14:40–14:42 |
| Diagram kinds, with a diagram open | 20 | verified: the panel’s list, read 14:43–14:44 |
| Switch from bar to lollipop | one press, data kept | verified: the editor’s kind read Lollipop chart after the press |
| A kind the data can’t take | refused, chart unchanged, what it needs named | verified: the card’s value and the editor’s line, 14:09 |
| File after Keep mine and Revert | byte-identical to the Guide’s | verified: git hash 458a2114… on both |
| Model calls to switch a kind | none | assumed: the switch showed no route or cost line and finished at once |
| Machine | MacBook Pro M3 Max, 36 GB, macOS 26.6 | verified |
Walked on: Orionfold Flow review build elements-1 (dev, main d43eb7f2), macOS 26.6, MacBook Pro M3 Max 36 GB, window 1512×949; walked 2026-10-26 14:06–14:44 PDT by the agent in an away session, one Flow instance; no model runs.
Data: The Flow Guide's Charts Gallery, whose exhibits are fictional teaching samples. The file the walk switched was reverted and read back byte-identical. The account row is painted over in every full-window shot.
Written by the Flow product team from the walk's own records. Numbers are labelled verified, derived, assumed or unknown.
MORE ELEMENTS
Another group,
walked the same way.
Elements: everything a document can take, one card at a time
Every block, action, skill and chart kind in one sidebar, and Ideas naming the skill that fits each section.
Fifteen blocks a document can hold, each written as a few plain lines
Fifteen blocks a document can hold, from a checklist a client signs to a chart beside its figures. Each stays plain text.
Twelve things Flow can do to your words, each waiting for your yes
Twelve actions on your words, from proofread, summarize and translate to tables, charts, sign-offs and forms. Each waits for your yes.
Nineteen skills that draw your document's case for you
Nineteen skills that turn a passage into a decision brief, a roadmap, a register or a figure you step through.