 ORIONFOLD
All elementsFlow Elements / Skills · 19 elements
Nineteen skills that draw your document's case for you
Nineteen skills that turn a passage into a decision brief, a roadmap, a register or a figure you step through.
Skills1 of 19
Architecture Diagram
The parts of a system, where they run, and what flows between.
Use it when a document explains how a product, service or pipeline is put together. Needs: at least 2 separate points. One run returns: only a diagram of the parts and their flows.
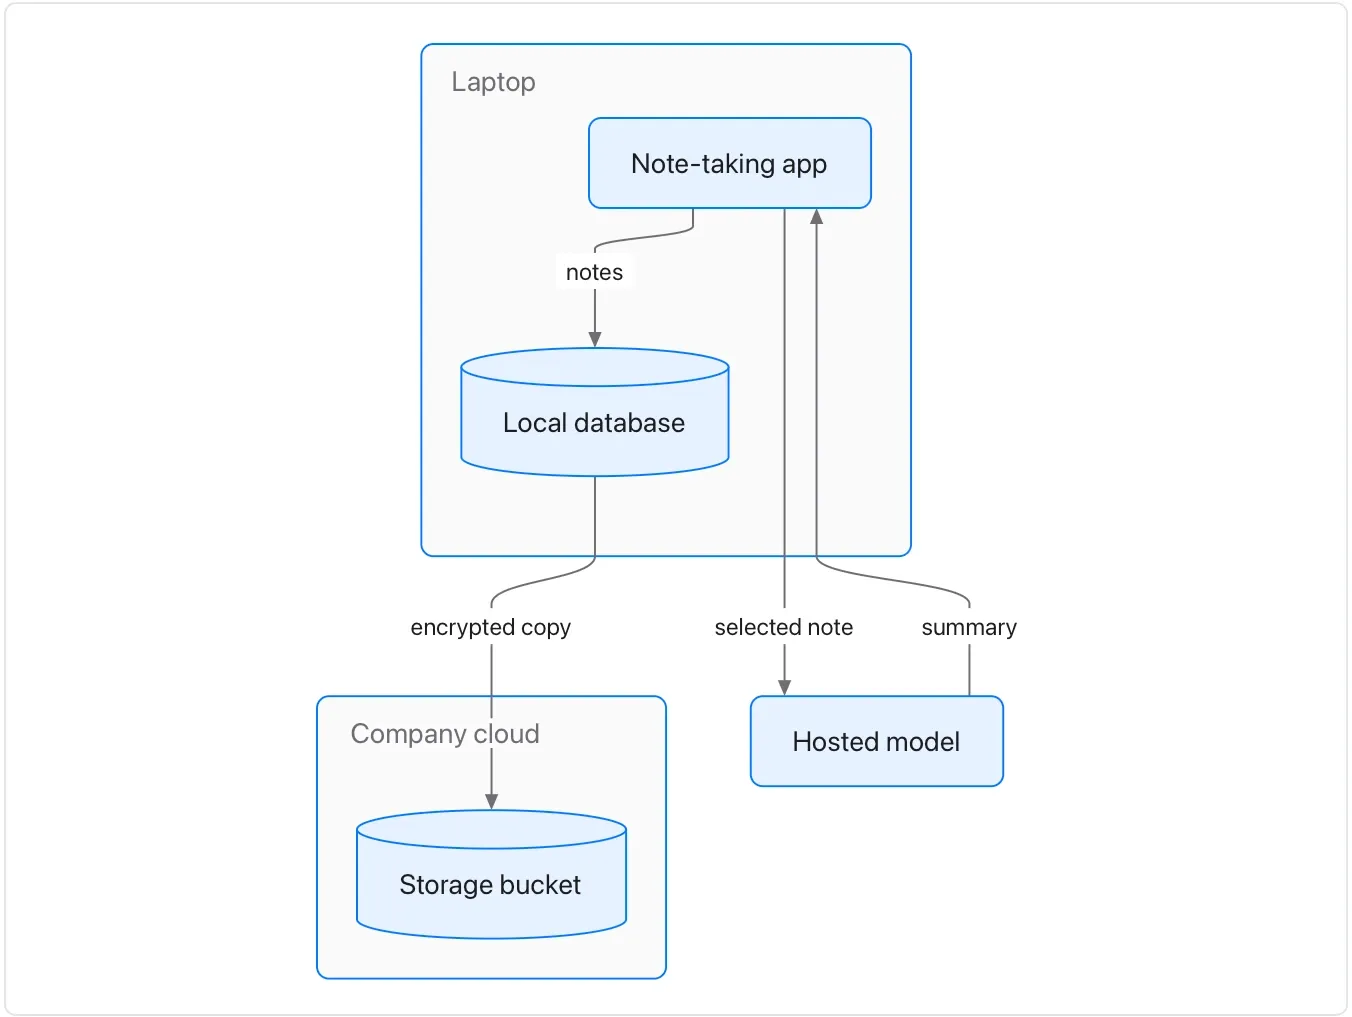
The note-taking app keeps every note in a local database on the laptop. When a person asks for a summary, the app sends the selected note to a hosted model and writes the summary back into the note. Sync sends encrypted copies of the database to the company’s storage bucket in its own cloud account.
Skills2 of 19
Decision Brief
The decision, the options, a recommendation and its sources.
Use it when a document is working towards a decision. Needs: at least 2 separate points. One run returns: a short written brief with an options table and a decision tree.
Our support desk contract renews on 1 December. Deskly has been fine, but the price goes up 20%. Helpline would connect to billing as well as the CRM, which the support lead says would save an hour a day, but moving takes a month and the team is short-handed until January. Finance’s quote puts Deskly at $30 a seat after the rise and Helpline at $40.

Skills3 of 19
Delegation Map
Who does each step, and where the work changes hands.
Use it when a document describes a process that several people or teams share. Needs: at least 2 separate points. One run returns: only a flowchart of who does each step.
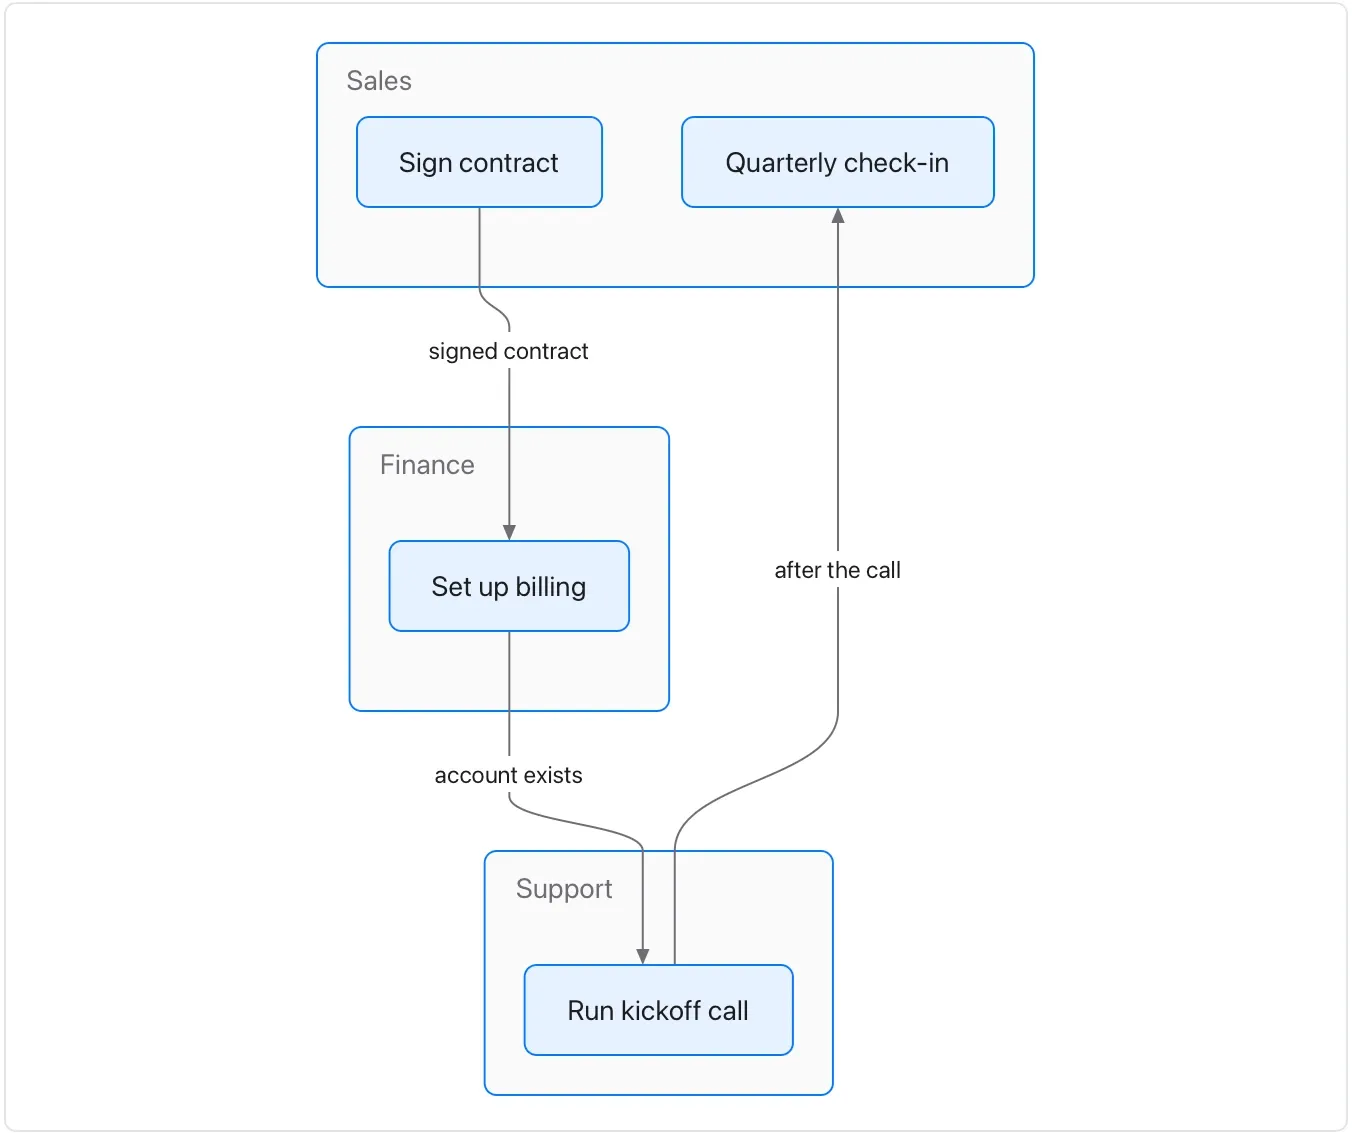
A new customer’s contract is signed by sales, who send it to finance to set up billing. Finance tells support once the account exists, and support runs the kickoff call. After the call, support hands the customer back to sales for the quarterly check-in. Finance says the hand-off from sales often arrives without the billing contact.
Skills4 of 19
Field-Notes Diagram
A technical idea's numbers drawn to scale, field-notes style.
Use it when a passage explains a technical concept through measurements, sizes, costs, timings or counts, and a reader should see their proportions. Needs: at least 2 numbers. One run returns: an animated infographic you step through.
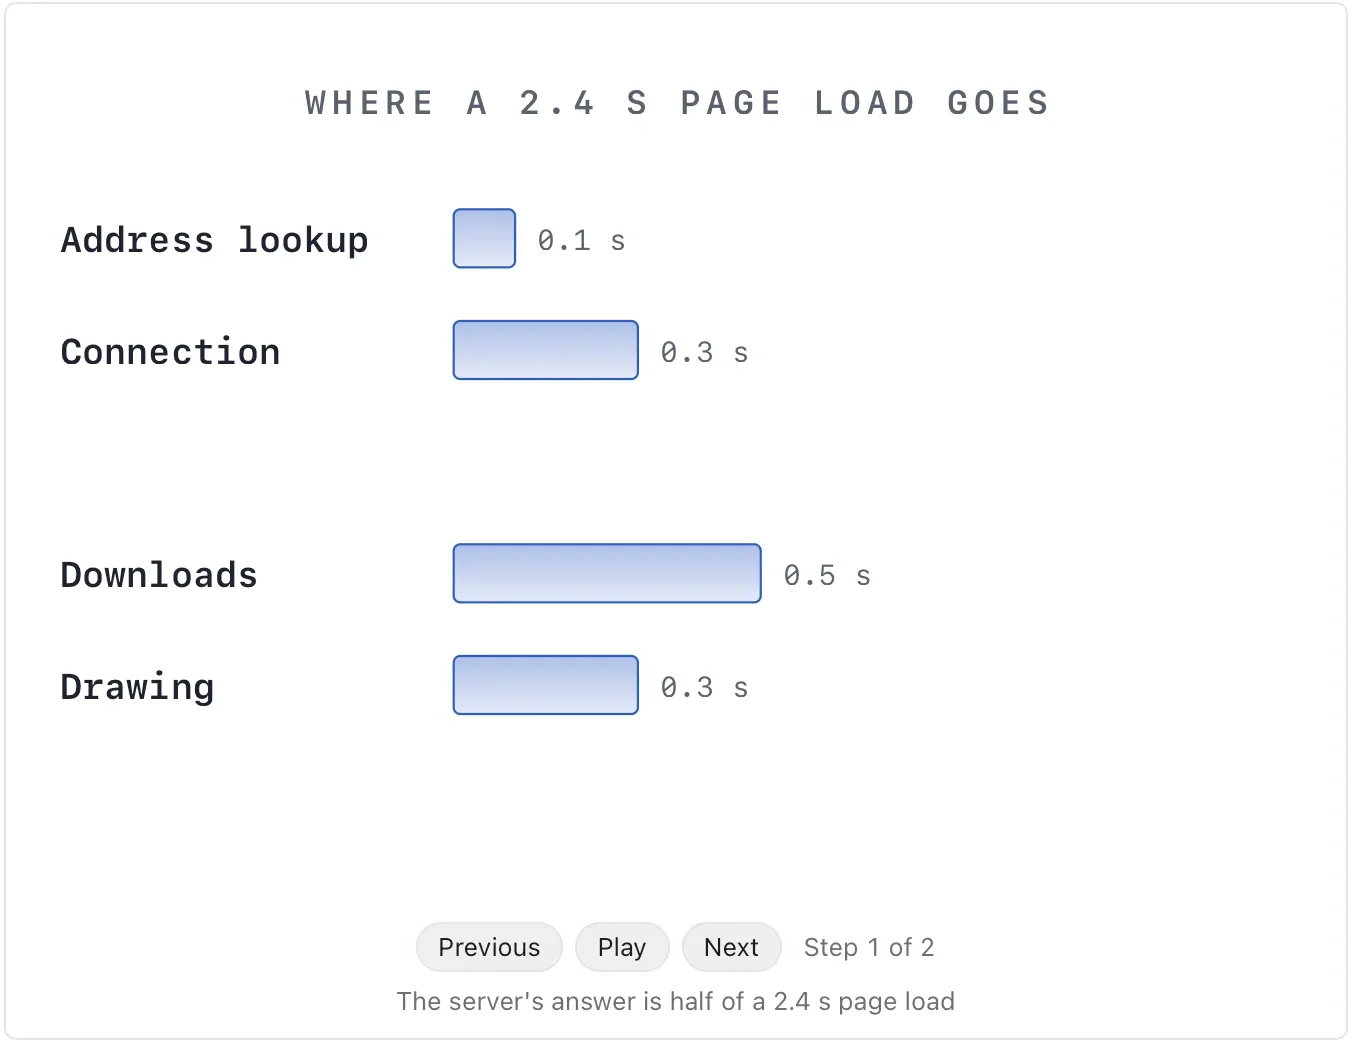
A product page takes 2.4 seconds to load. Looking up the address takes 0.1 s, opening the connection and its encryption 0.3 s, and the server takes 1.2 s to answer. Downloading the images and scripts then takes 0.5 s, and drawing the page 0.3 s. The server’s answer is half of the wait, and it is the part worth fixing first.
Skills5 of 19
Guided Exercise
A passage turned into steps a learner works through and signs.
Use it when a document teaches something a reader should try for themselves. Needs: at least 2 separate points. One run returns: only a form a learner works through and signs.
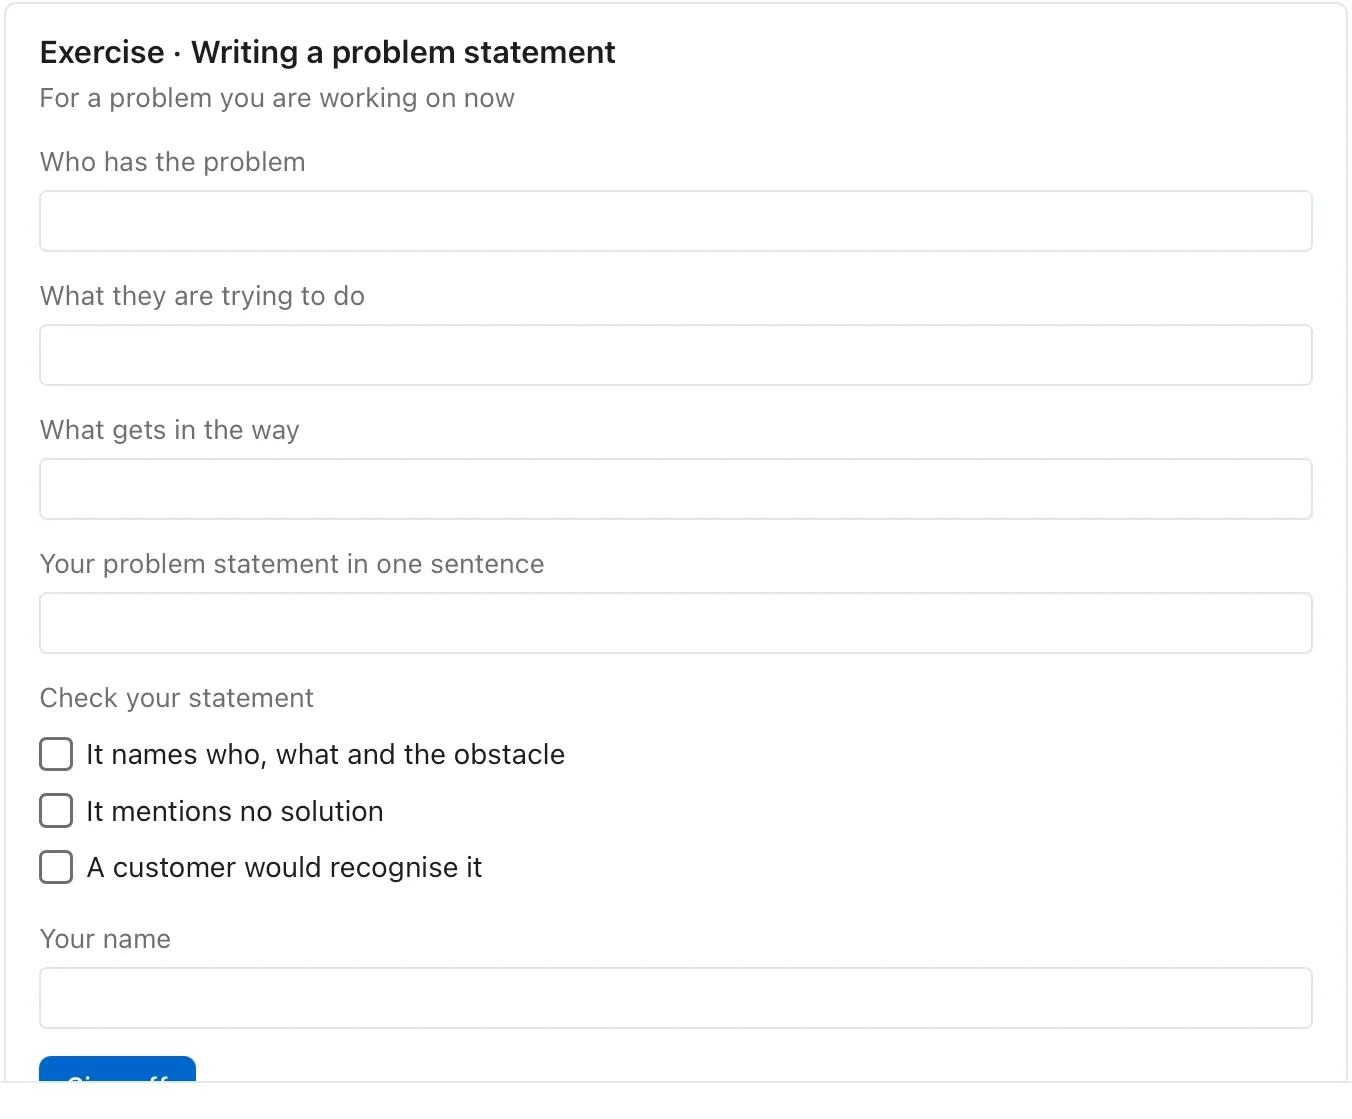
A good problem statement names who has the problem, what they are trying to do, and what gets in the way — before it mentions any solution. Write it in one sentence, then test it by asking whether a customer would recognise it.
Skills6 of 19
Isometric Figure
A layered stack in depth; press a layer to read what it does.
Use it when a document describes something built in layers — a technology stack, an organisation’s tiers, a product’s levels. Needs: at least 2 separate points. One run returns: an interactive visual. Press a layer to lift it and read what it does.
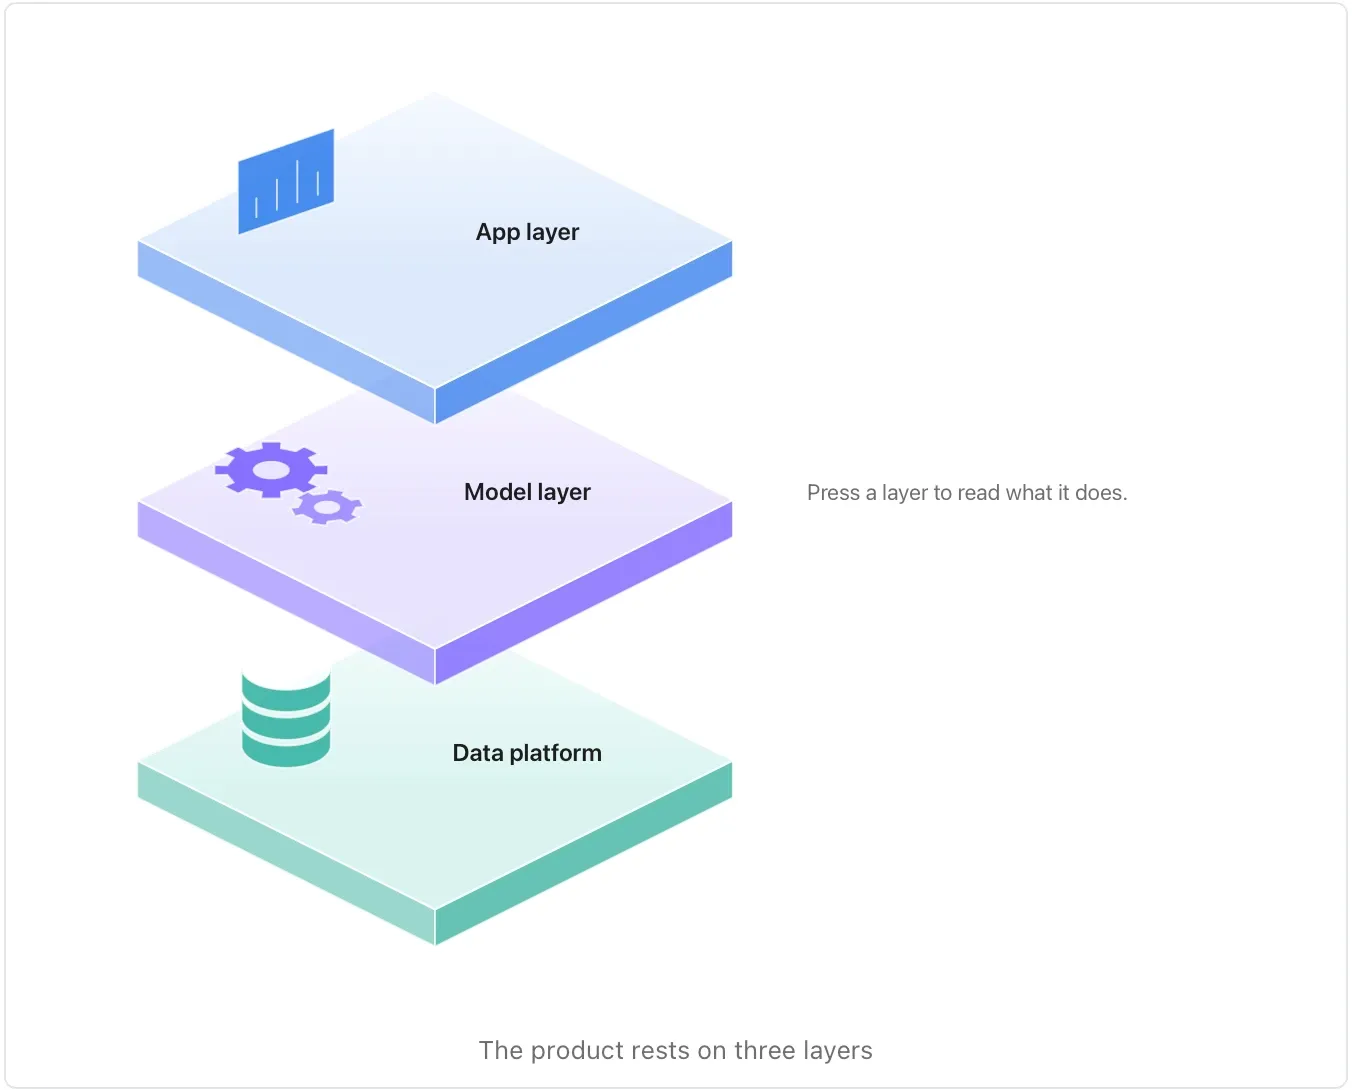
Our product rests on three layers. At the bottom, the data platform stores every customer event and keeps it for two years. On top of it, the model layer turns those events into forecasts each night. The app layer, on top, shows each team its forecast and lets them adjust it.
Skills7 of 19
Landscape Map
Who is in a market or field, grouped, with each one's source.
Use it when a document surveys a market, a field or a set of alternatives. Needs: at least 3 separate points. One run returns: a mind map and a table.
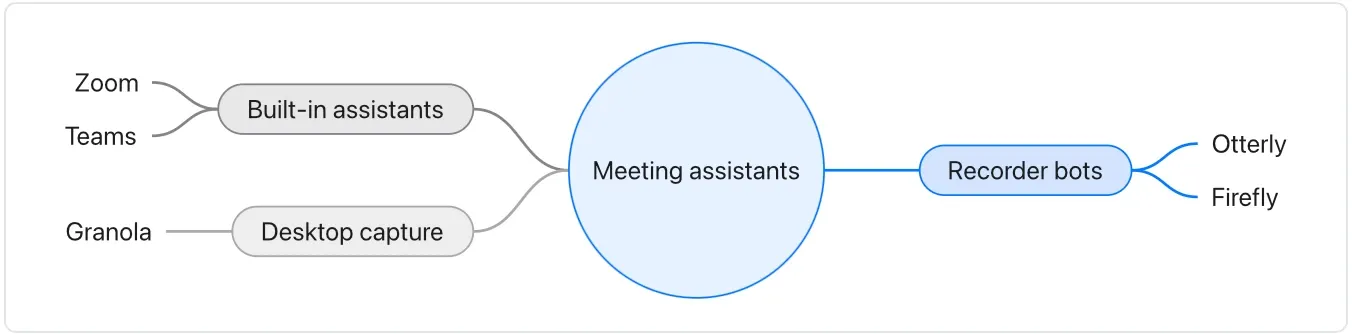
Meeting assistants split three ways. Recorder bots such as Otterly and Firefly join the call as a participant (per each vendor’s site). Built-in assistants come with the meeting tool itself: Zoom’s and Teams’ own (their 2026 release notes). Desktop capture tools such as Granola record from the laptop without joining the call.
Skills8 of 19
Opportunity Map
Initiatives placed by value and effort, with the case for each.
Use it when a document lists options to prioritise. Needs: at least 2 separate points. One run returns: a chart of value against effort and a table.
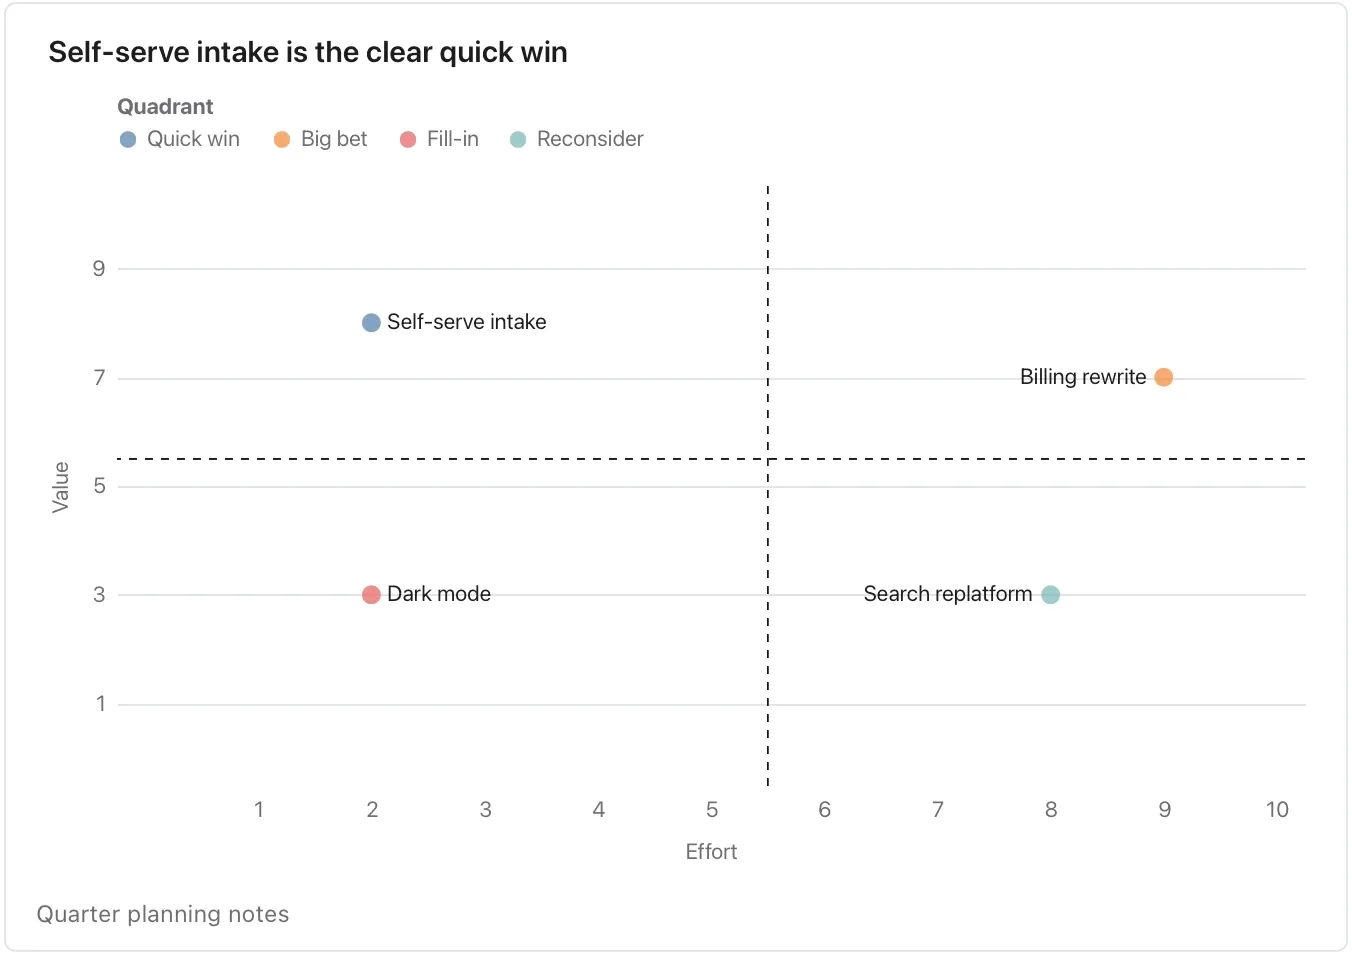
This quarter we could ship self-serve intake, which support says would remove a third of their tickets and takes one engineer two weeks. A billing rewrite would fix the invoicing errors finance complains about but needs three engineers for a quarter and a migration. A dark-mode theme is a common request with little revenue behind it; a designer estimates a week. Replatforming search onto a new engine would cut hosting cost slightly and take two months of the platform team.
Skills9 of 19
Option Comparison
Options side by side on the facts that tell them apart.
Use it when a document is choosing between a few ways forward. Needs: at least 2 separate points. One run returns: a table, and a chart when the options share one measure in one unit; otherwise it says why there is none.
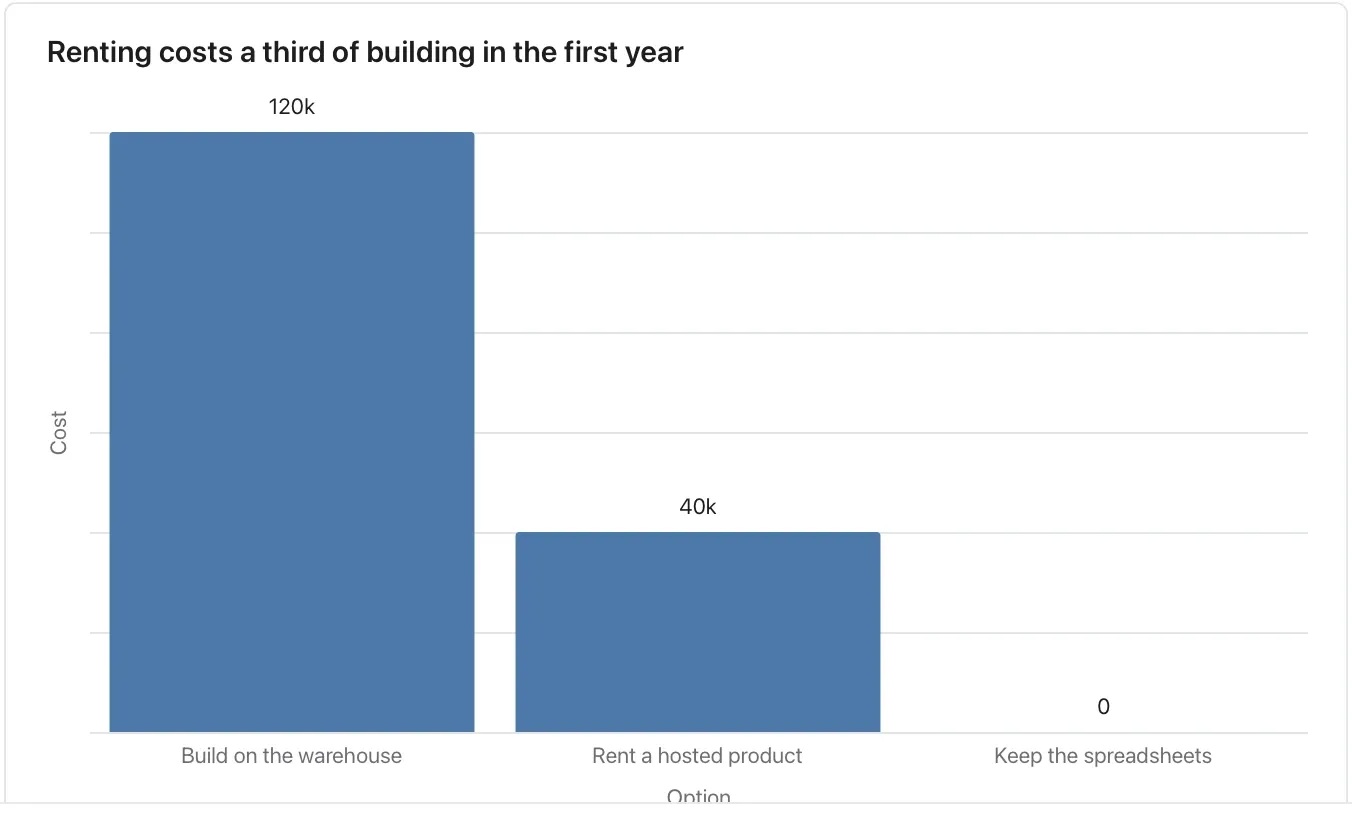
For the new analytics stack we can build on our warehouse, which the data team prices at $120k in the first year and four months of work; rent a hosted product at $40k a year, live in three weeks, though our data then leaves our cloud; or keep the spreadsheets we have, which costs nothing new but cannot handle next year’s volume.
Skills10 of 19
Path Card
A feature on one card, with who it is for, the steps, the path and the proof.
Use it when a document introduces a feature, a service or an offer, and a reader should grasp it at a glance. Needs: at least 2 separate points. One run returns: an animated card you step through.
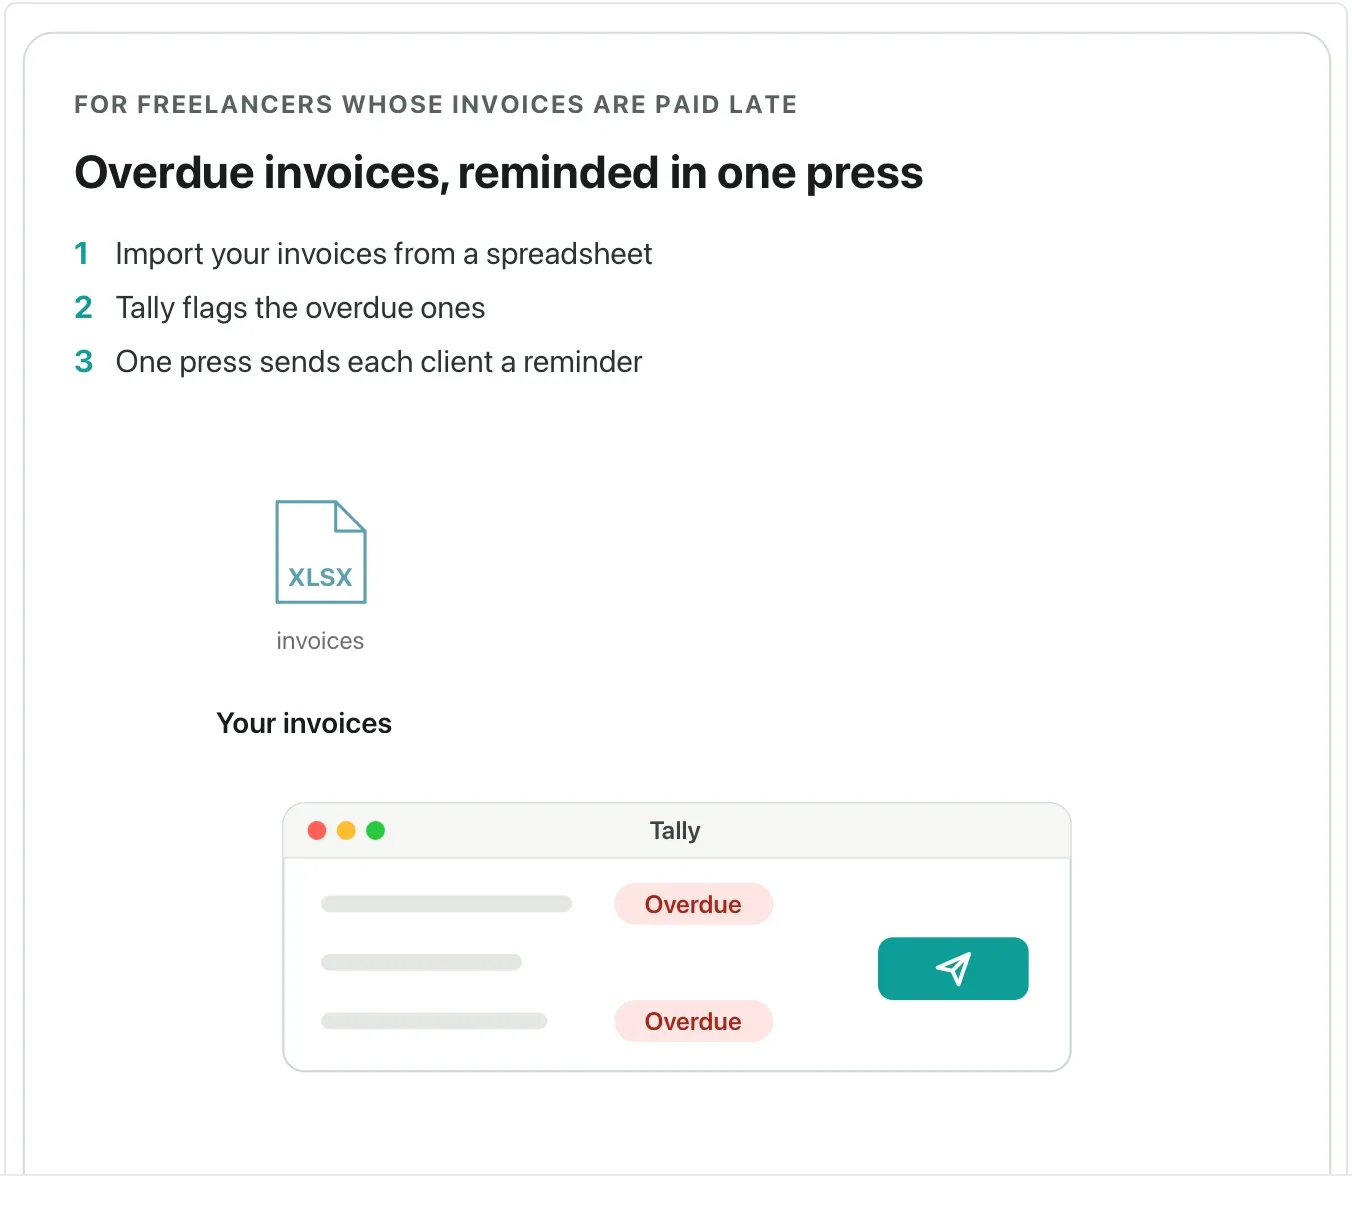
Tally’s reminders are for freelancers whose invoices are paid late. Import your invoices from a spreadsheet, Tally flags the overdue ones, and one press sends each client a reminder with the invoice attached as a PDF. In a pilot with 40 invoices, freelancers were paid 9 days sooner on average.
Skills11 of 19
Product Mock
A user journey played out in a mock of the product's window.
Use it when a document describes how someone uses a product, a feature or a prototype, and a reader should see it happen. Needs: at least 3 separate points. One run returns: an animated mock you step through.
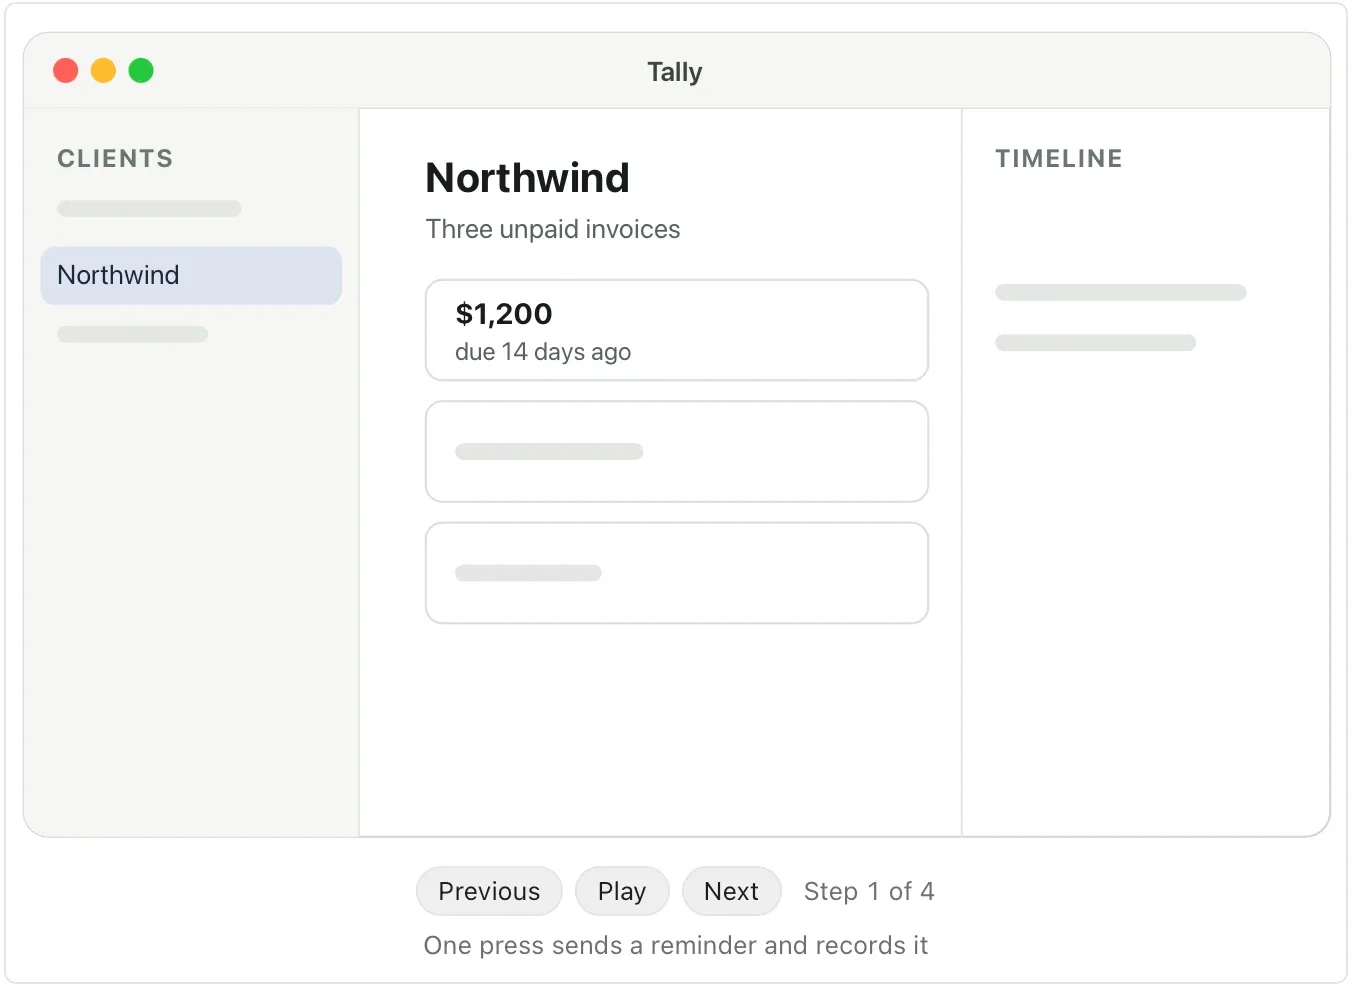
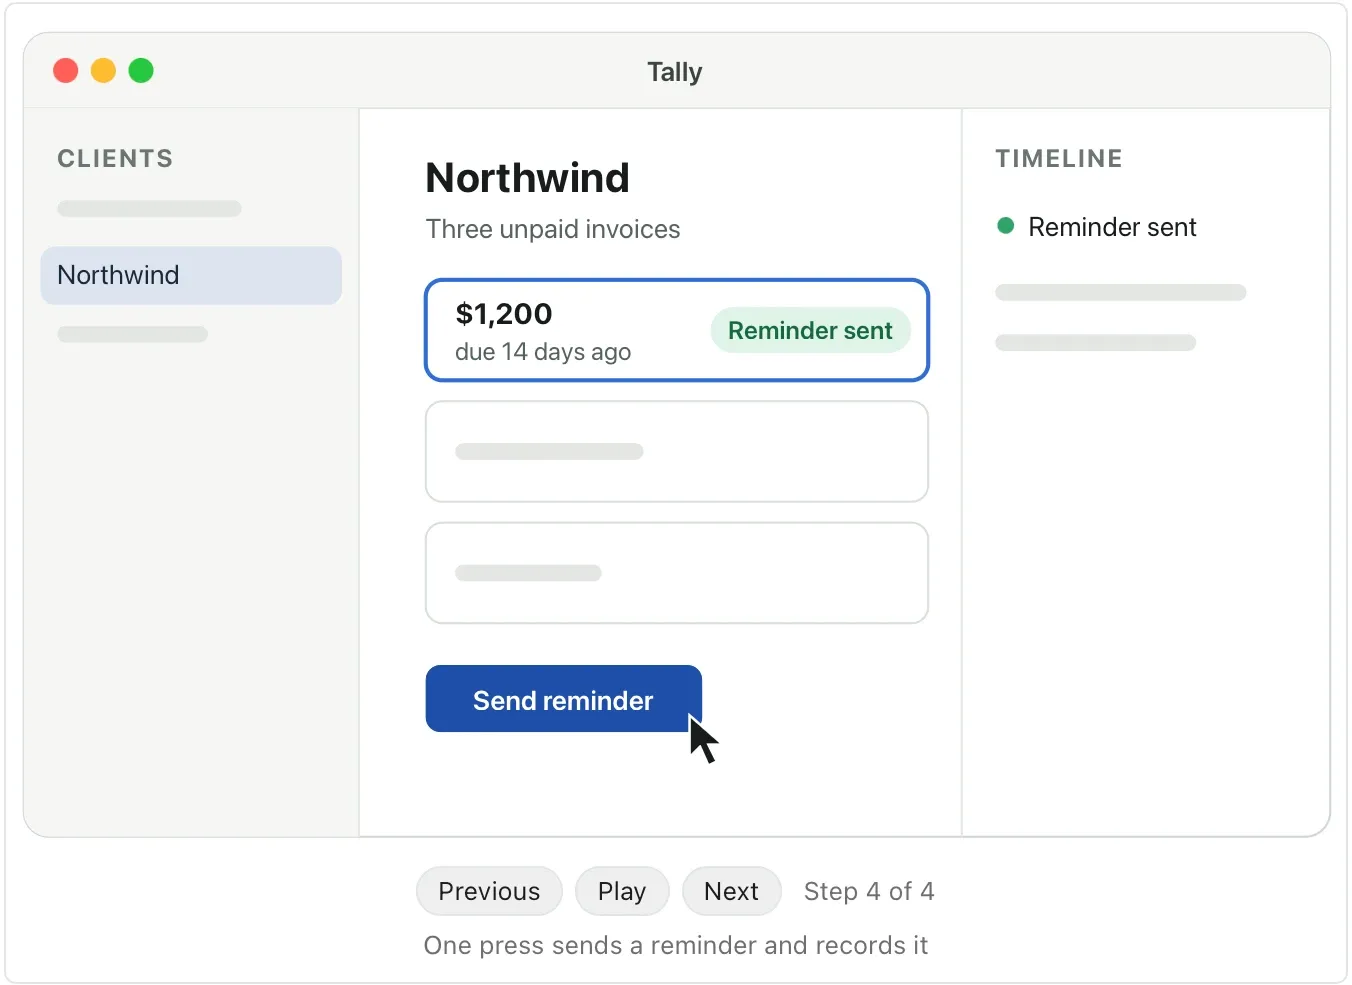
In Tally, a freelancer’s invoicing app, Maya opens her list of clients and picks Northwind. The client’s page shows three unpaid invoices. She presses Send reminder on the oldest one, $1,200, due 14 days ago. Tally marks the invoice Reminder sent and adds the reminder to the client’s timeline.
Skills12 of 19
Register
Risks, issues or decisions logged with an owner and a check.
Use it when a document raises things someone must keep an eye on. Needs: at least 2 separate points. One run returns: only a table.
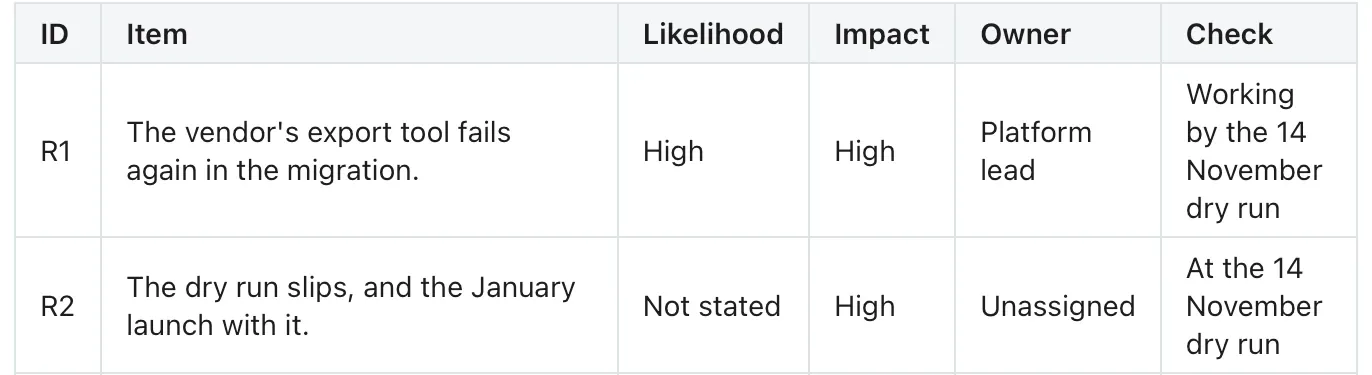
The migration depends on the vendor’s export tool, which failed twice in testing; the platform lead is chasing them and wants it working by the 14 November dry run. Legal has not yet confirmed the new data residency terms. If the dry run slips, the January launch slips with it, which marketing says would be costly.
Skills13 of 19
Roadmap
Work laid out over time, by workstream, with its milestones.
Use it when a document plans work with dates, durations or a sequence. Needs: at least 2 separate points and a date. One run returns: only a timeline chart.
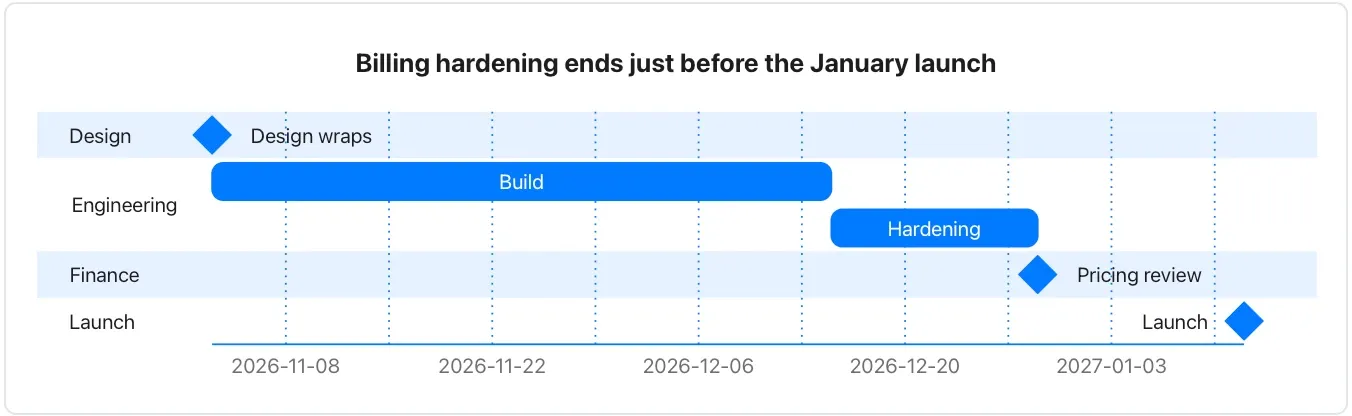
Design for the new billing flow wraps on 3 November 2026. Engineering starts the same day and needs six weeks, then two weeks of hardening. Finance wants a pricing review once hardening is done, and the launch is set for 12 January 2027. Marketing will start the launch page in December.
Skills14 of 19
Scenario Model
Low, base and high cases from stated ranges, and a choice.
Use it when a document plans against an uncertain number. Needs: at least 2 numbers. One run returns: a chart and a form.
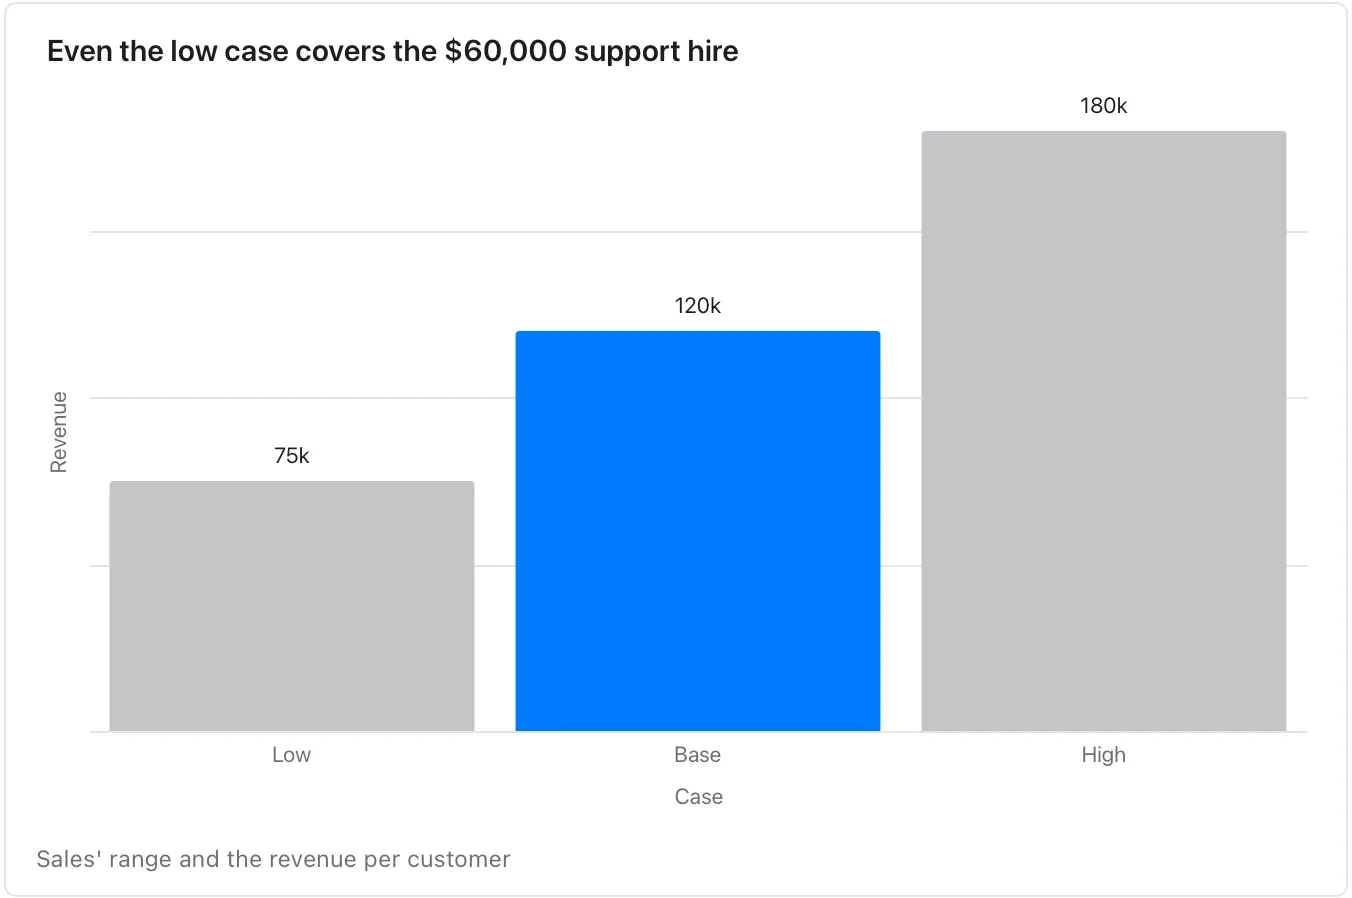
We expect 40 new customers next quarter, though sales says it could be anywhere from 25 to 60. Each brings about $3,000 in the quarter. The support hire we are weighing costs $60,000 a quarter.
Skills15 of 19
Scorecard
Each candidate scored against weighted criteria, then signed off.
Use it when a document compares a few candidates against stated criteria. Needs: at least 2 separate points. One run returns: a table and a sign-off form.
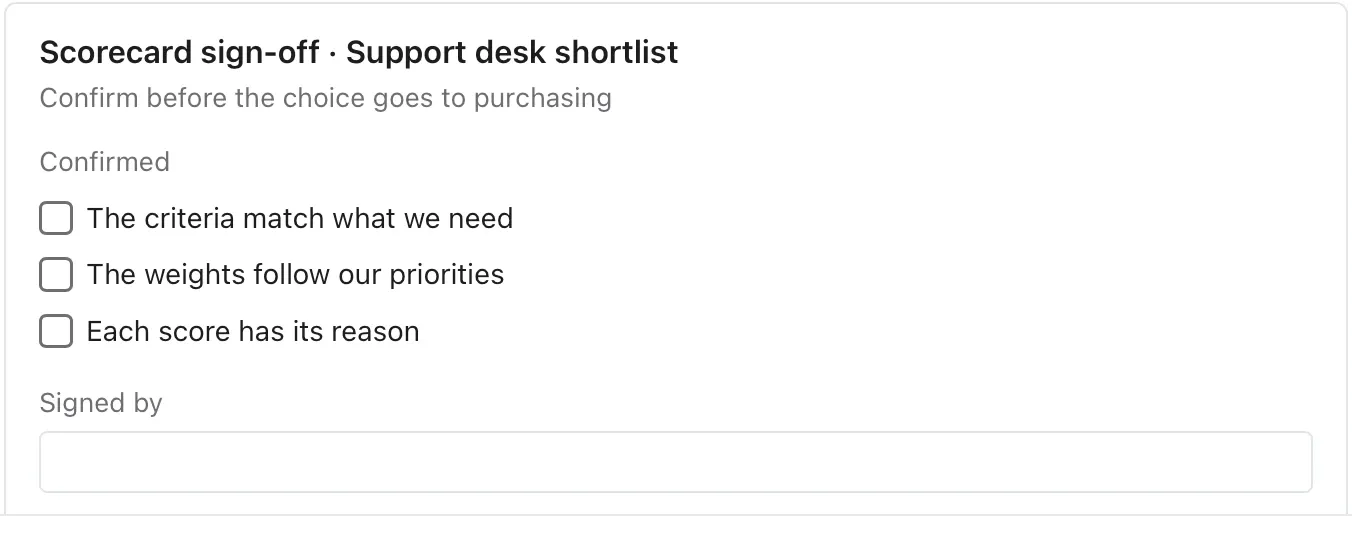
We shortlisted two support desks. Price matters most, then the integrations, then setup time. Helpline is $40 a seat and needs a month to set up, but connects to our CRM and billing. Deskly is $25 a seat and sets up in a week, though it only connects to the CRM.
Skills16 of 19
System Explainer
A system's parts, its flows, and what a failure changes.
Use it when a document describes how components, teams or stages pass work to each other. Needs: at least 2 separate points. One run returns: an animated visual you step through, with parts you can press.
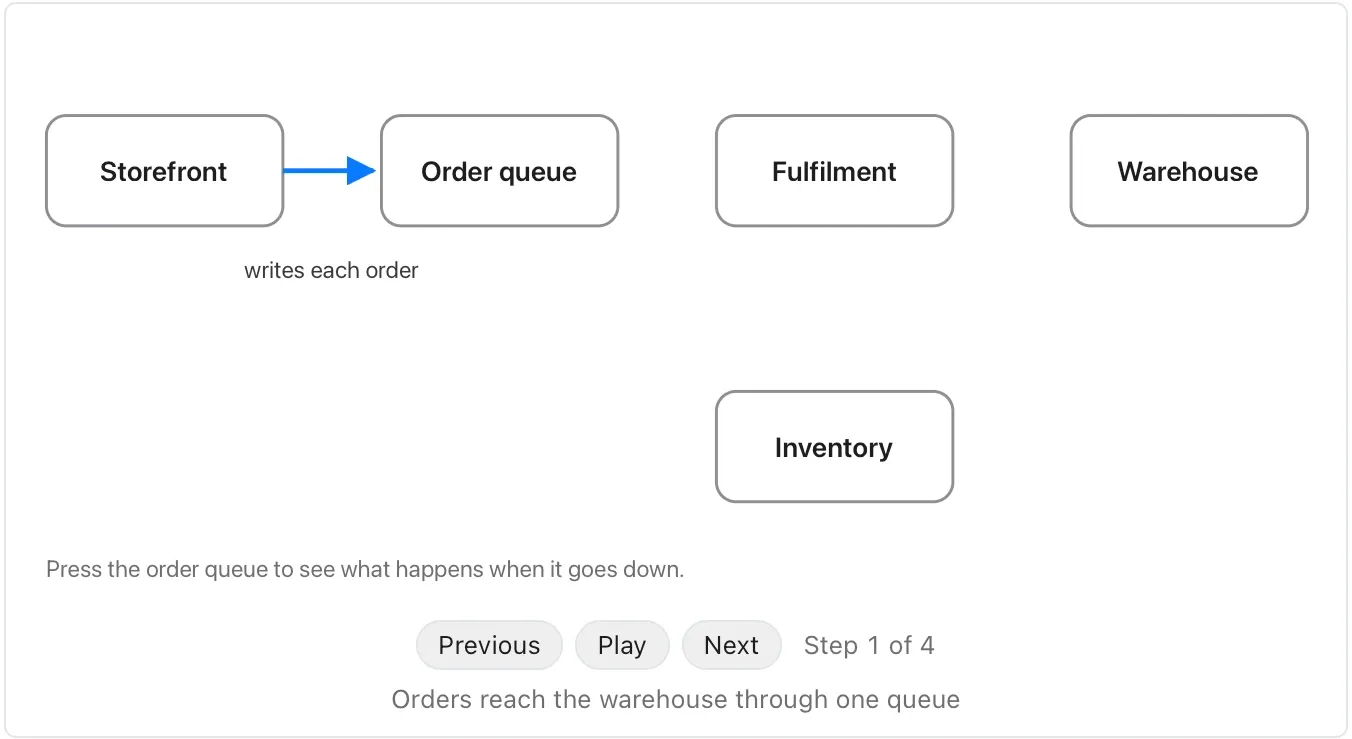
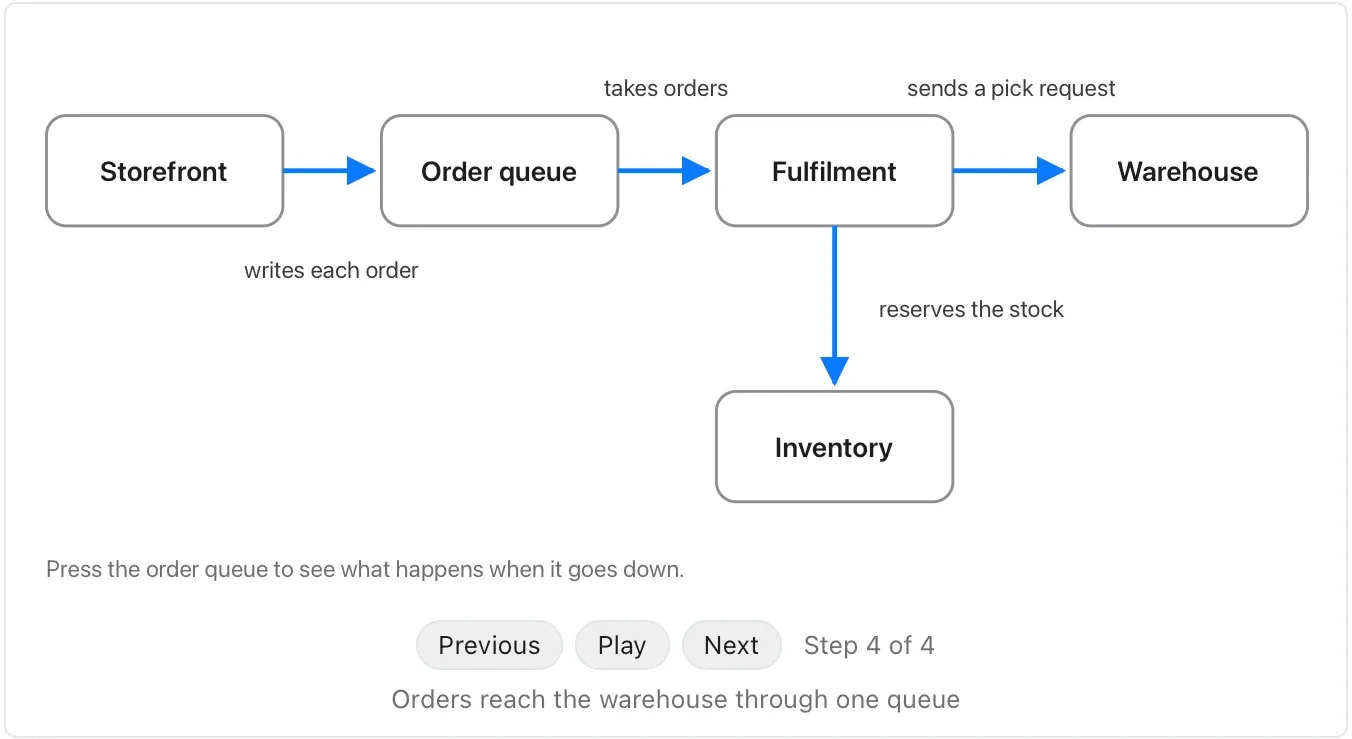
Customers place orders on the storefront, which writes each order to the order queue. The fulfilment service takes orders from the queue, asks the inventory service to reserve the stock, then sends a pick request to the warehouse. The queue is the single point of failure: if it goes down, the storefront keeps taking orders but cannot hand them on, so they wait in its retry buffer and nothing reaches the warehouse until the queue recovers.
Skills17 of 19
Value Model
The value a change creates, from its stated assumptions.
Use it when a document argues that something is worth doing and gives numbers for it. Needs: at least 2 numbers. One run returns: a table of its assumptions and a chart.
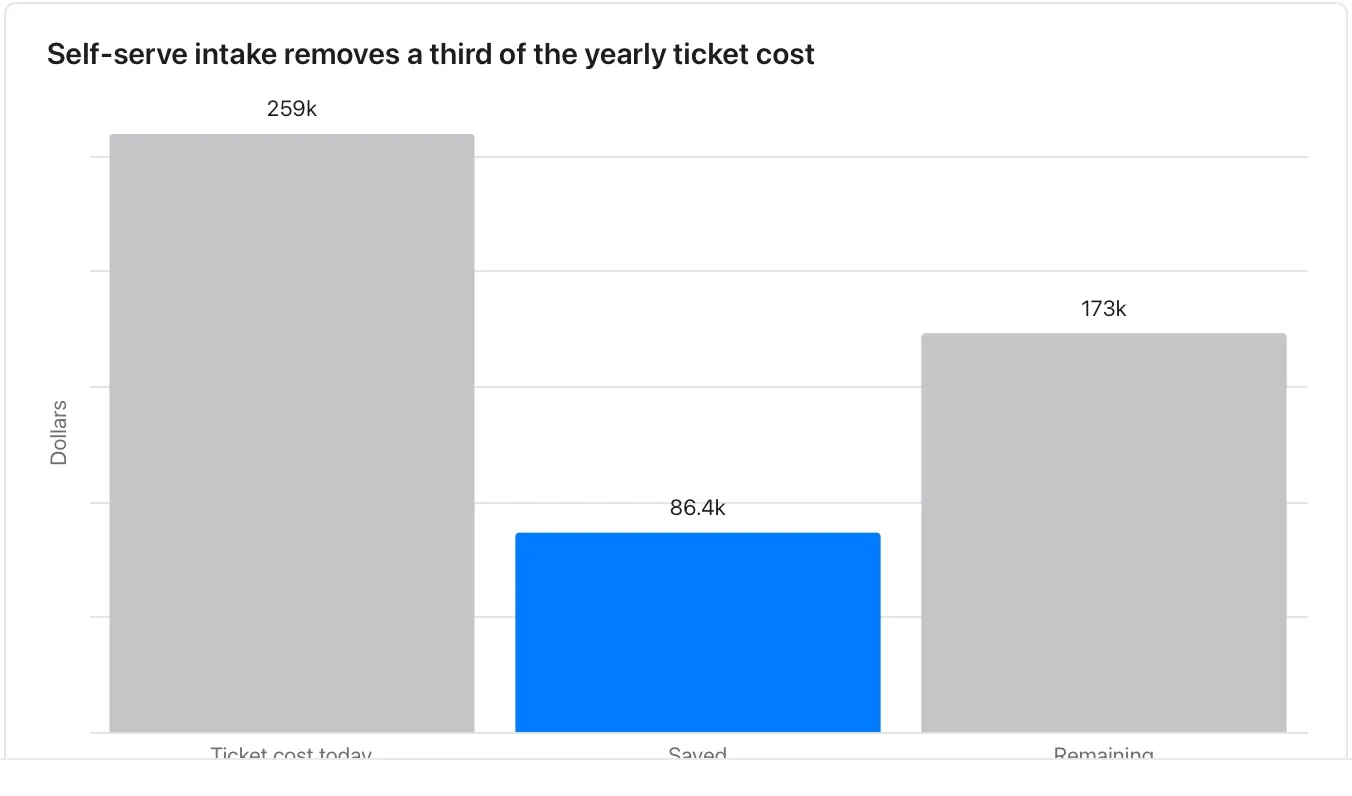
Support handles about 1,200 tickets a month. Their lead estimates self-serve intake would remove a third of them. Finance puts the loaded cost of a ticket at $18.
Skills18 of 19
Visual Explainer
One idea from the text, drawn so it builds step by step.
Use it when a passage explains how something works and a reader would follow it faster as a picture. Needs: at least 2 separate points. One run returns: an animated visual you step through.
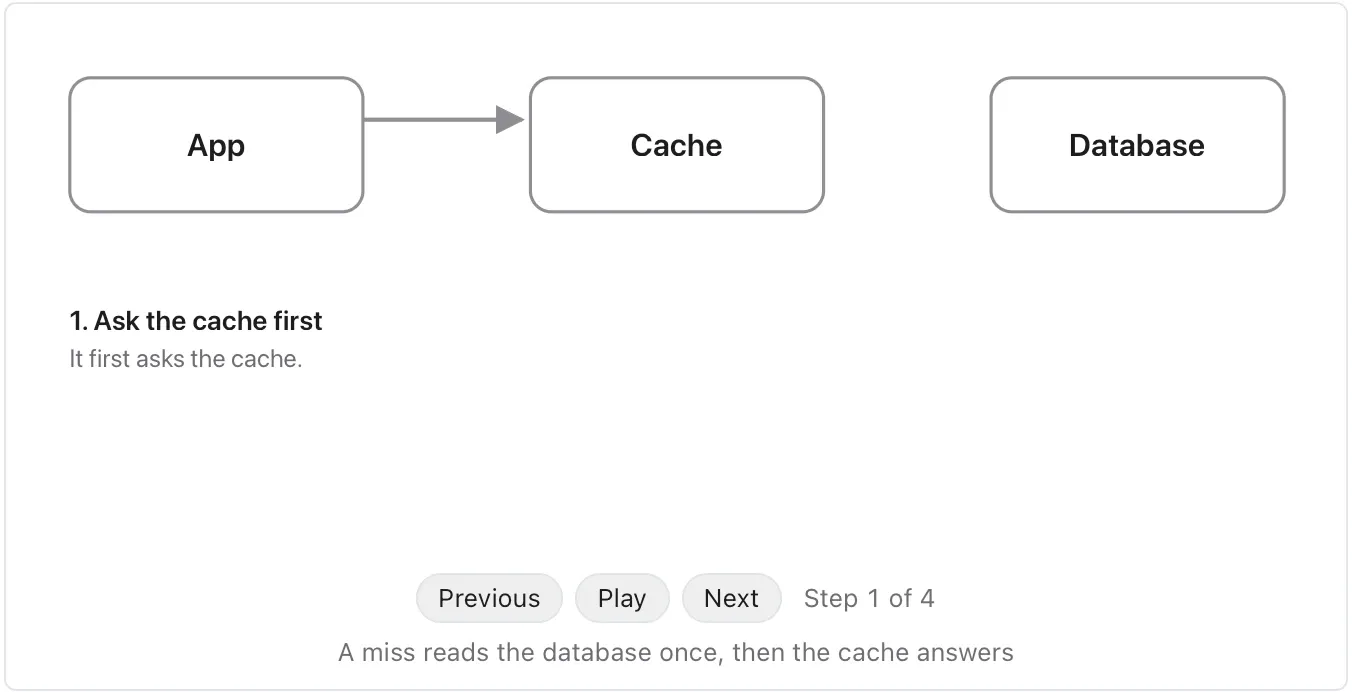
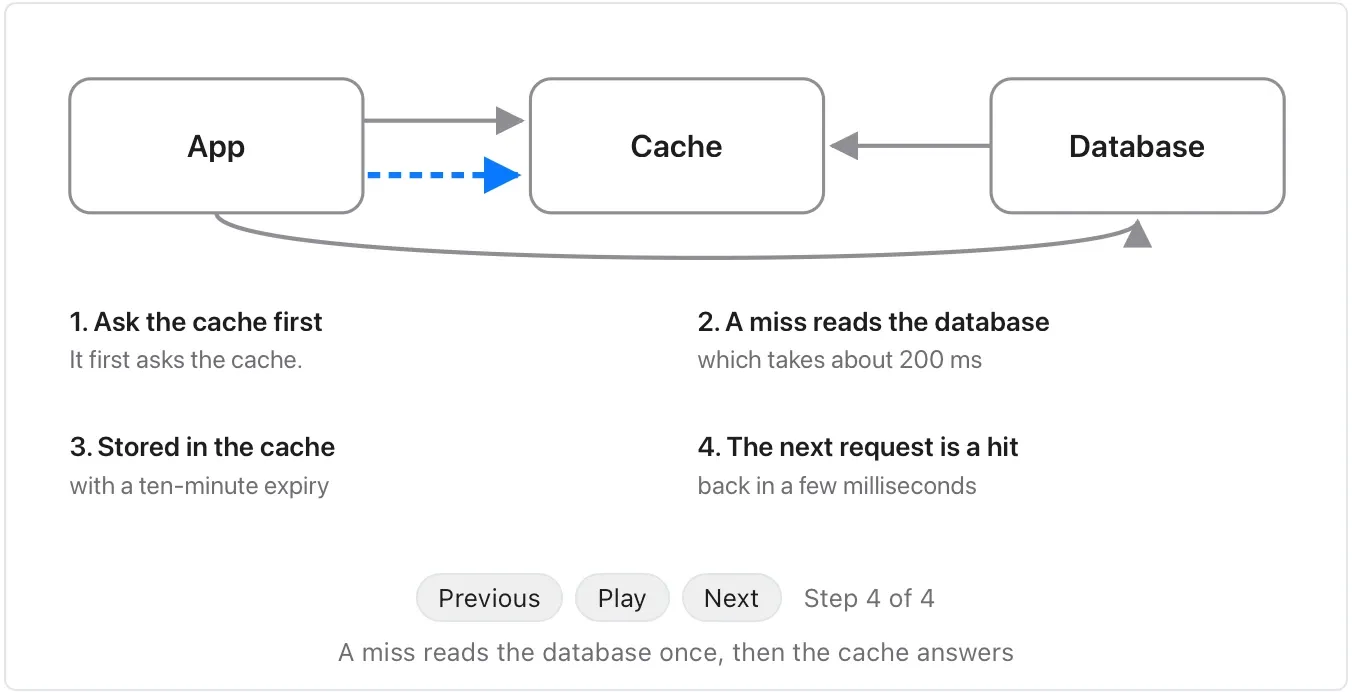
When the app needs a product page it first asks the cache. If the cache has the page, it comes back in a few milliseconds. If not, that is a miss: the app reads the page from the database, which takes about 200 ms, stores it in the cache with a ten-minute expiry, and returns it. The next request for the same page is a hit.
Skills19 of 19
Workflow Path
A workflow drawn as what goes in, the work, and what comes out.
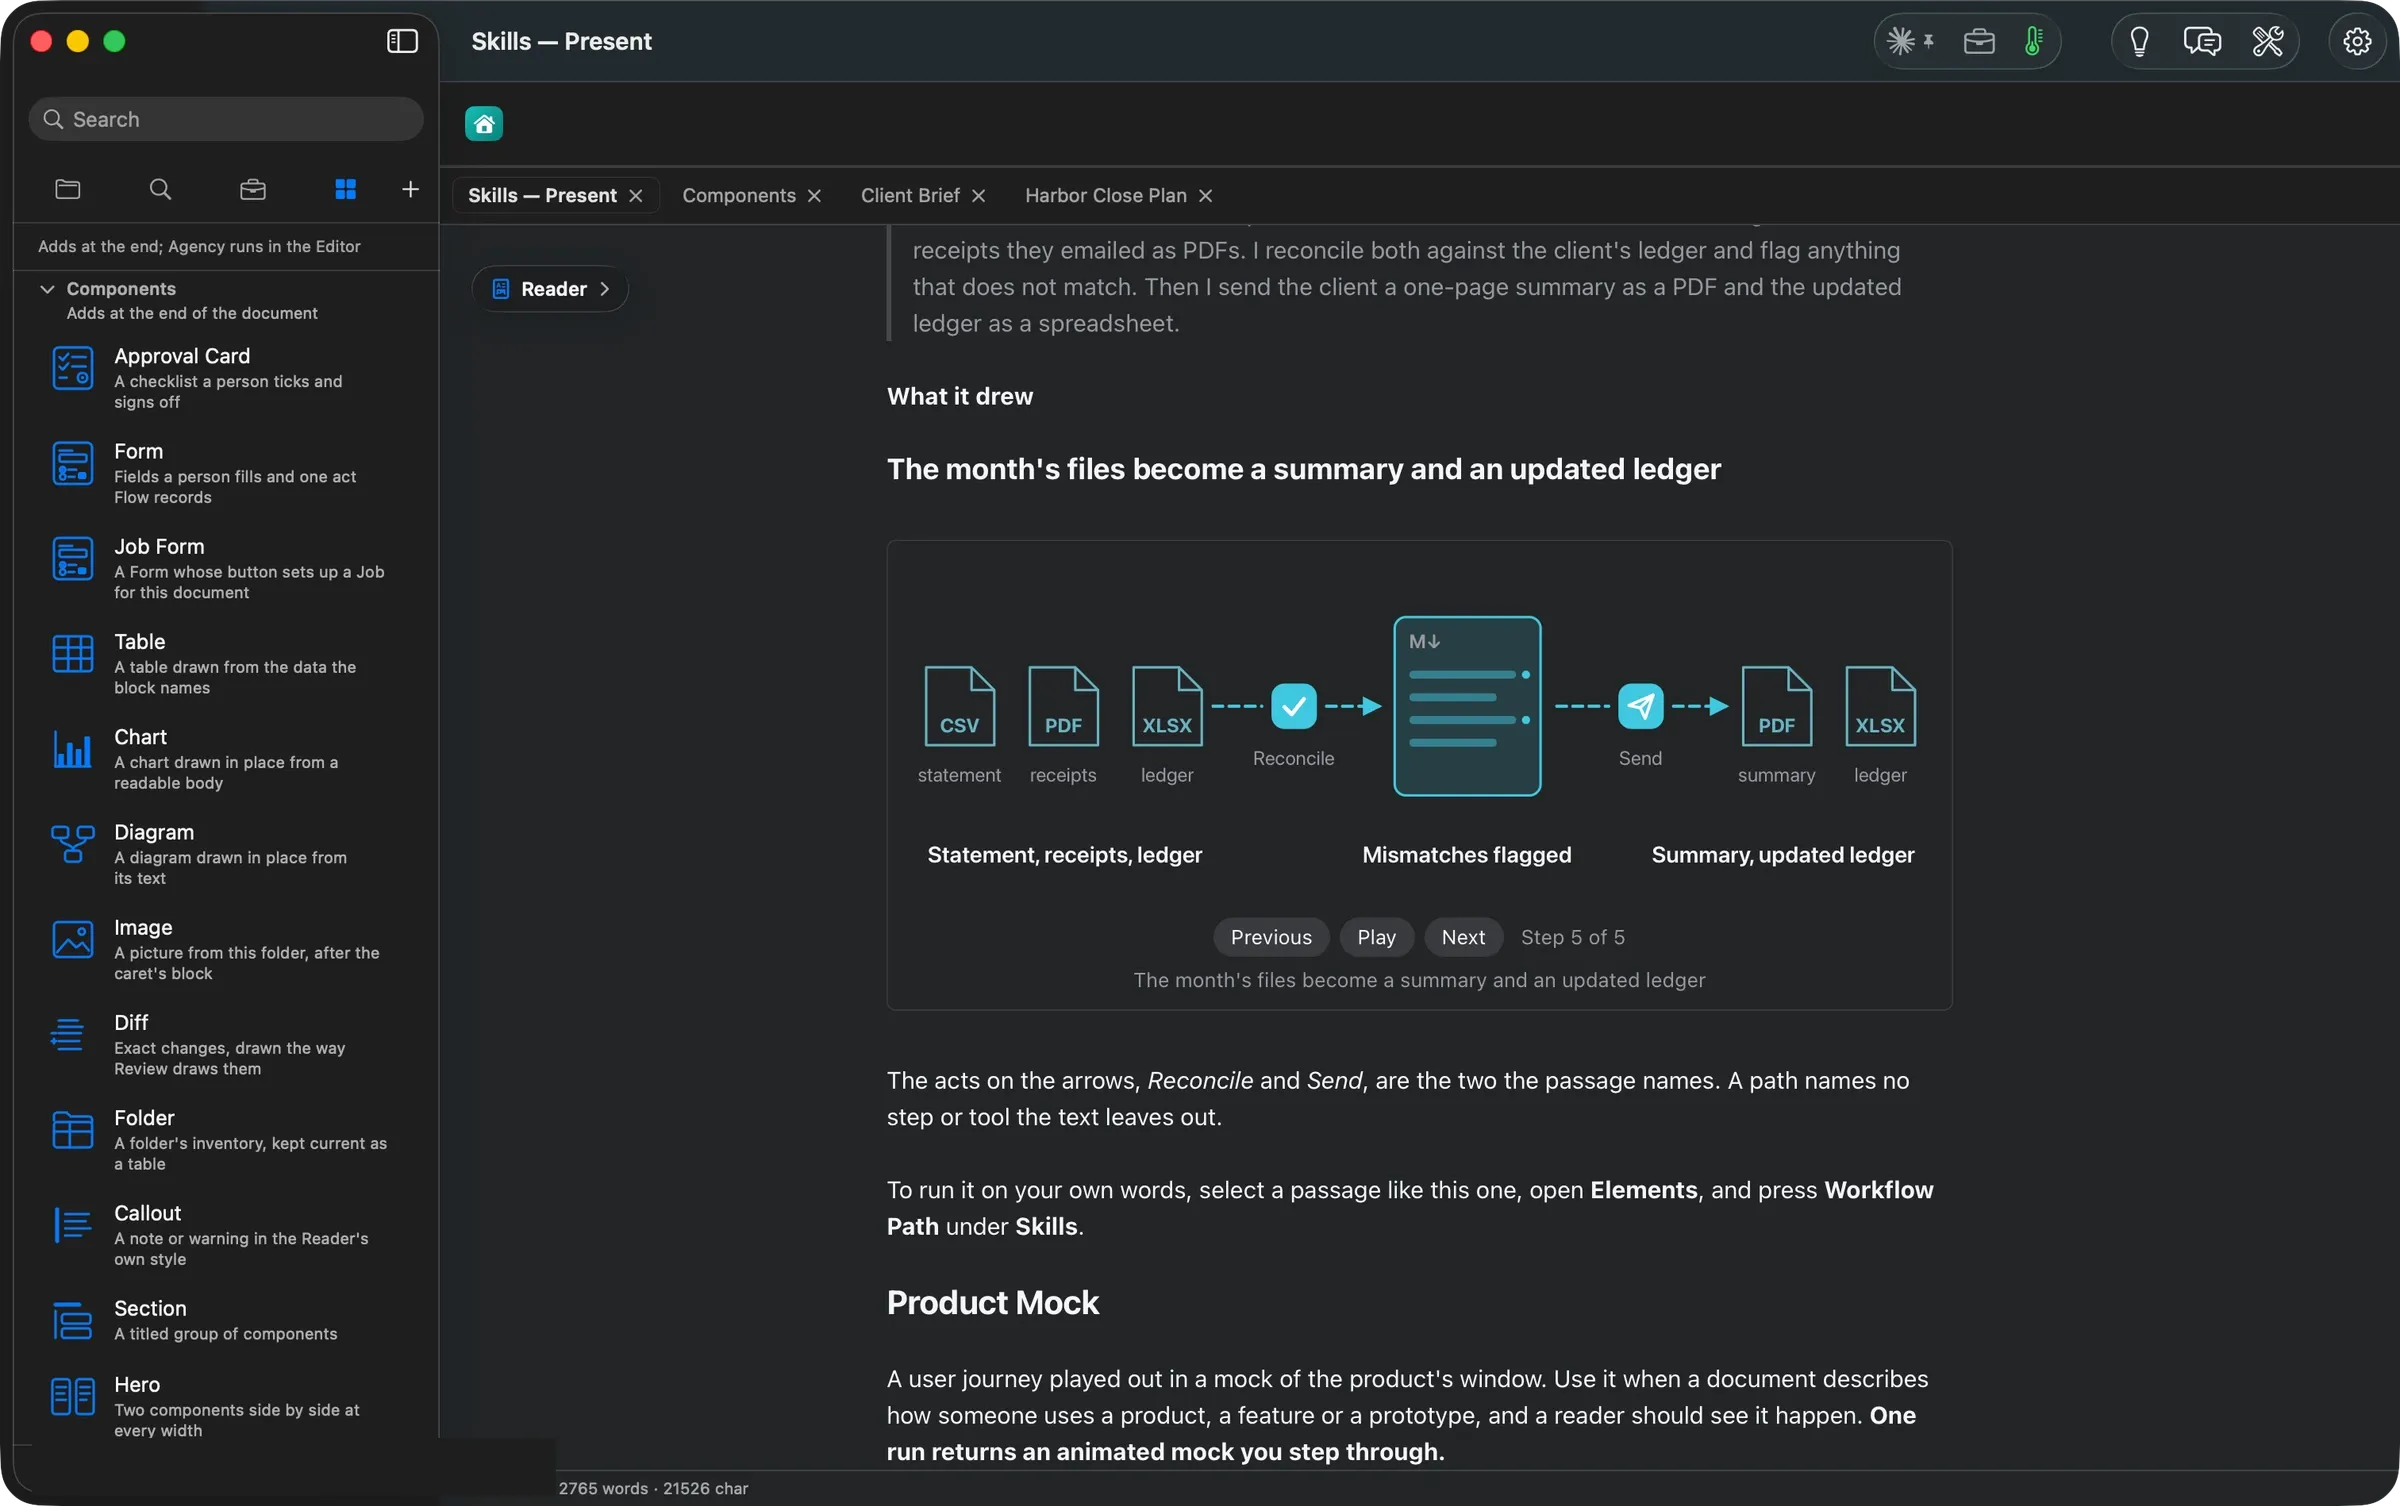
Use it when a document describes a recurring piece of work and a reader should see its shape at a glance. Needs: at least 2 separate points. One run returns: an animated path you step through.
At the start of each month I export the client’s bank statement as a CSV and gather the receipts they emailed as PDFs. I reconcile both against the client’s ledger and flag anything that does not match. Then I send the client a one-page summary as a PDF and the updated ledger as a spreadsheet.
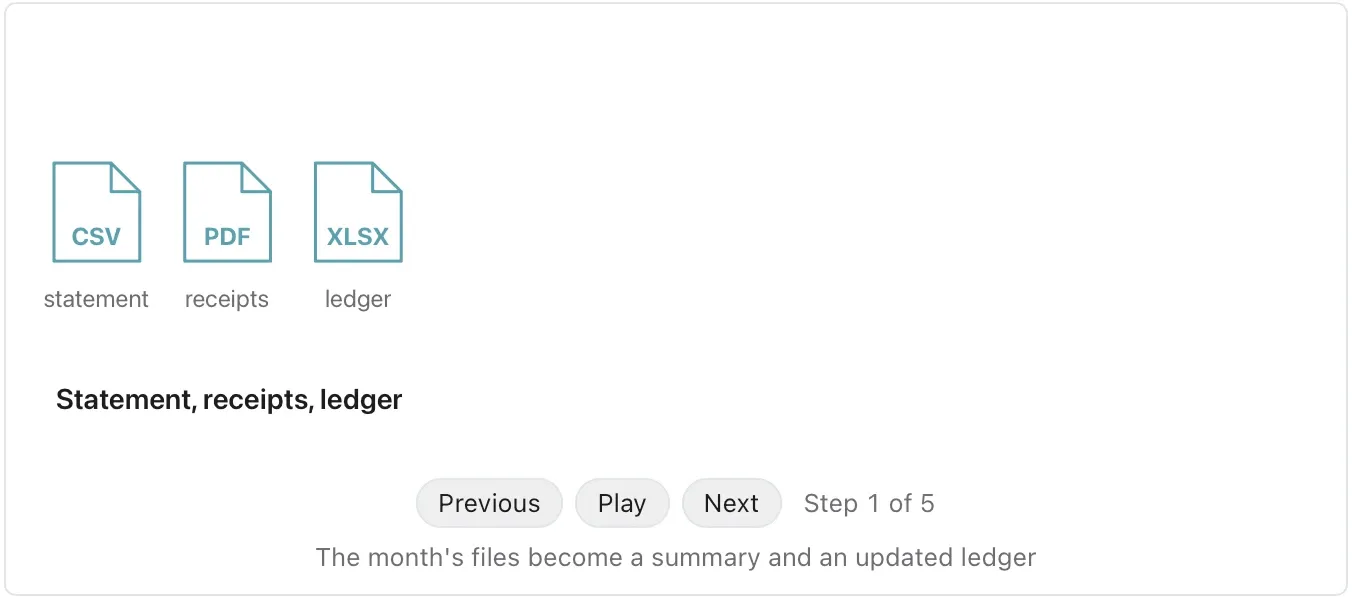
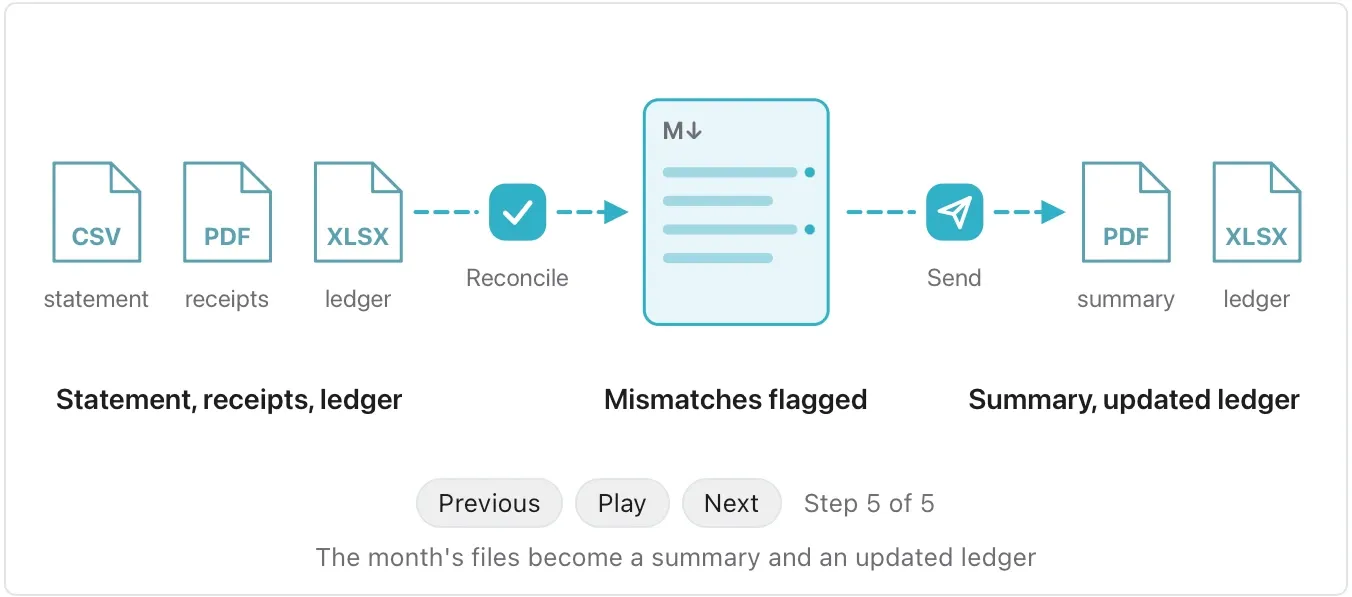
A skill is a method Flow applies to a passage. It reads what you selected and draws the answer as a decision brief, a comparison table, a roadmap, a register, a map or an animated figure you step through. Elements ▸ Skills lists all nineteen, each with a drawing in its own colour. Before a skill runs, its sheet checks that your text has what the method needs. In this walk one skill ran live on a plan, by way of an idea, and came back in about 50 seconds with a figure drawn exactly to scale. The Skills Gallery shows what every other skill draws from a short passage.
What Flow does
Select a paragraph, press a skill, and Flow draws its case as the brief, the table, the timeline or the figure. Orionfold Flow ships nineteen skills, listed in Elements (⌘5) under Skills. Each turns one kind of passage into the form that reader needs. A discussion of choices becomes a decision brief with a decision tree. A list of initiatives becomes a value-and-effort map. Dated work becomes a roadmap, and a layered system becomes an isometric figure you can press. A recurring piece of work becomes a path from files in to deliverables out. Before anything runs, the skill’s sheet counts whether your text has what the method needs, such as separate points, numbers or a date, and recommends Cancel when it doesn’t. The result is placed right after the paragraph you selected and waits in Review Changes. What a skill draws is saved in the document as text, so it opens anywhere and prints when you publish. Ideas can choose the skill for you, section by section.
The answer first
- Select the passage the skill should read. With nothing selected, it reads the whole document.
- Press ⌘5 and press the skill’s card under Skills. Or let Ideas (⌘3) suggest one per section and press the idea.
- Read the sheet. It shows what the skill will read, its steps, and a check of what your text has: 46 words to read · 5 numbers to work with. Press Run Skill when it says Ready to run.
- Review the result in Review Changes. A figure that builds in steps has Previous, Play and Next under it. Keep it, or discard it.
- Open the Flow Guide’s Skills Gallery to see every skill’s passage and what it drew, grouped by the question your text asks. The groups are Decide, Plan, Explain, Present.
The job
A plan that says “three options, here are the costs” asks the reader to build the comparison in their head. A paragraph about who hands what to whom asks them to draw the flowchart. Most people know the form their argument wants, such as a table, a timeline or a map. Few have the time to draw it in another tool and keep it in step with the text. A skill draws it from the text you already wrote, in a form Flow keeps as part of the document.
A skill, run on a real section
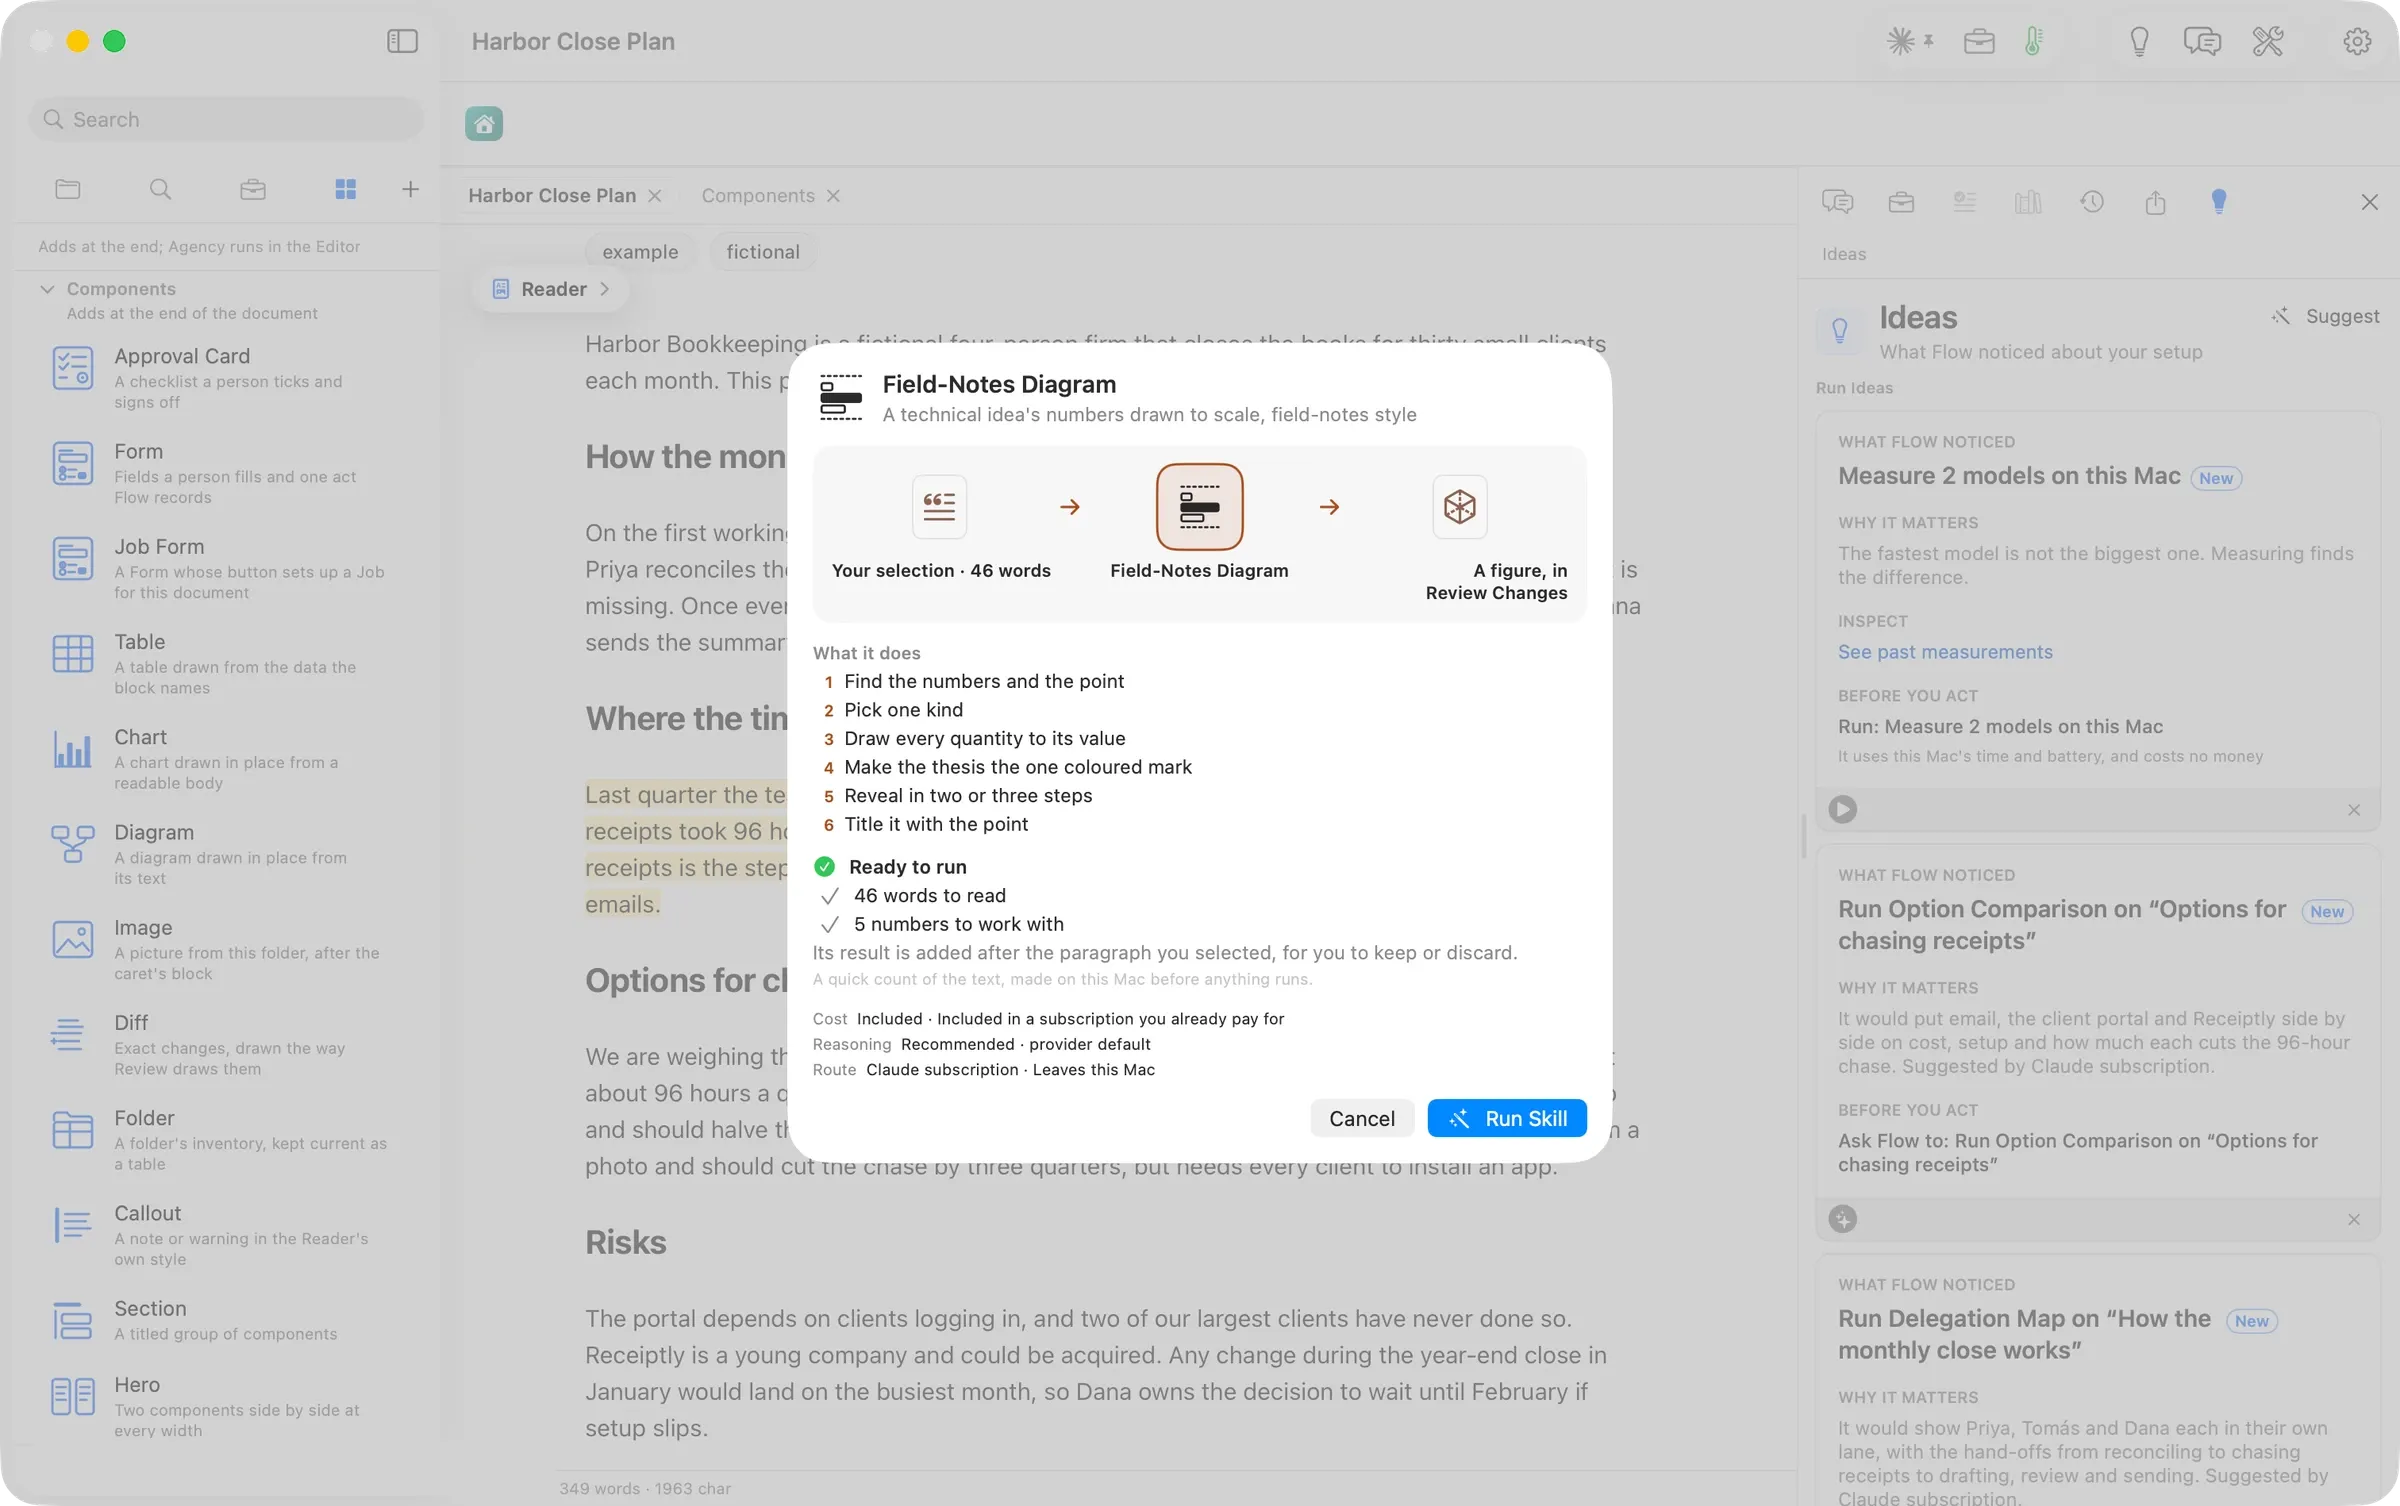
On Harbor Close Plan, Ideas suggested Field-Notes Diagram for the section Where the time goes. Pressing the idea selected the section and opened the skill’s sheet. It showed its six steps, and a check that found 5 numbers to work with. Every skill opens the same sheet when you press its card yourself.
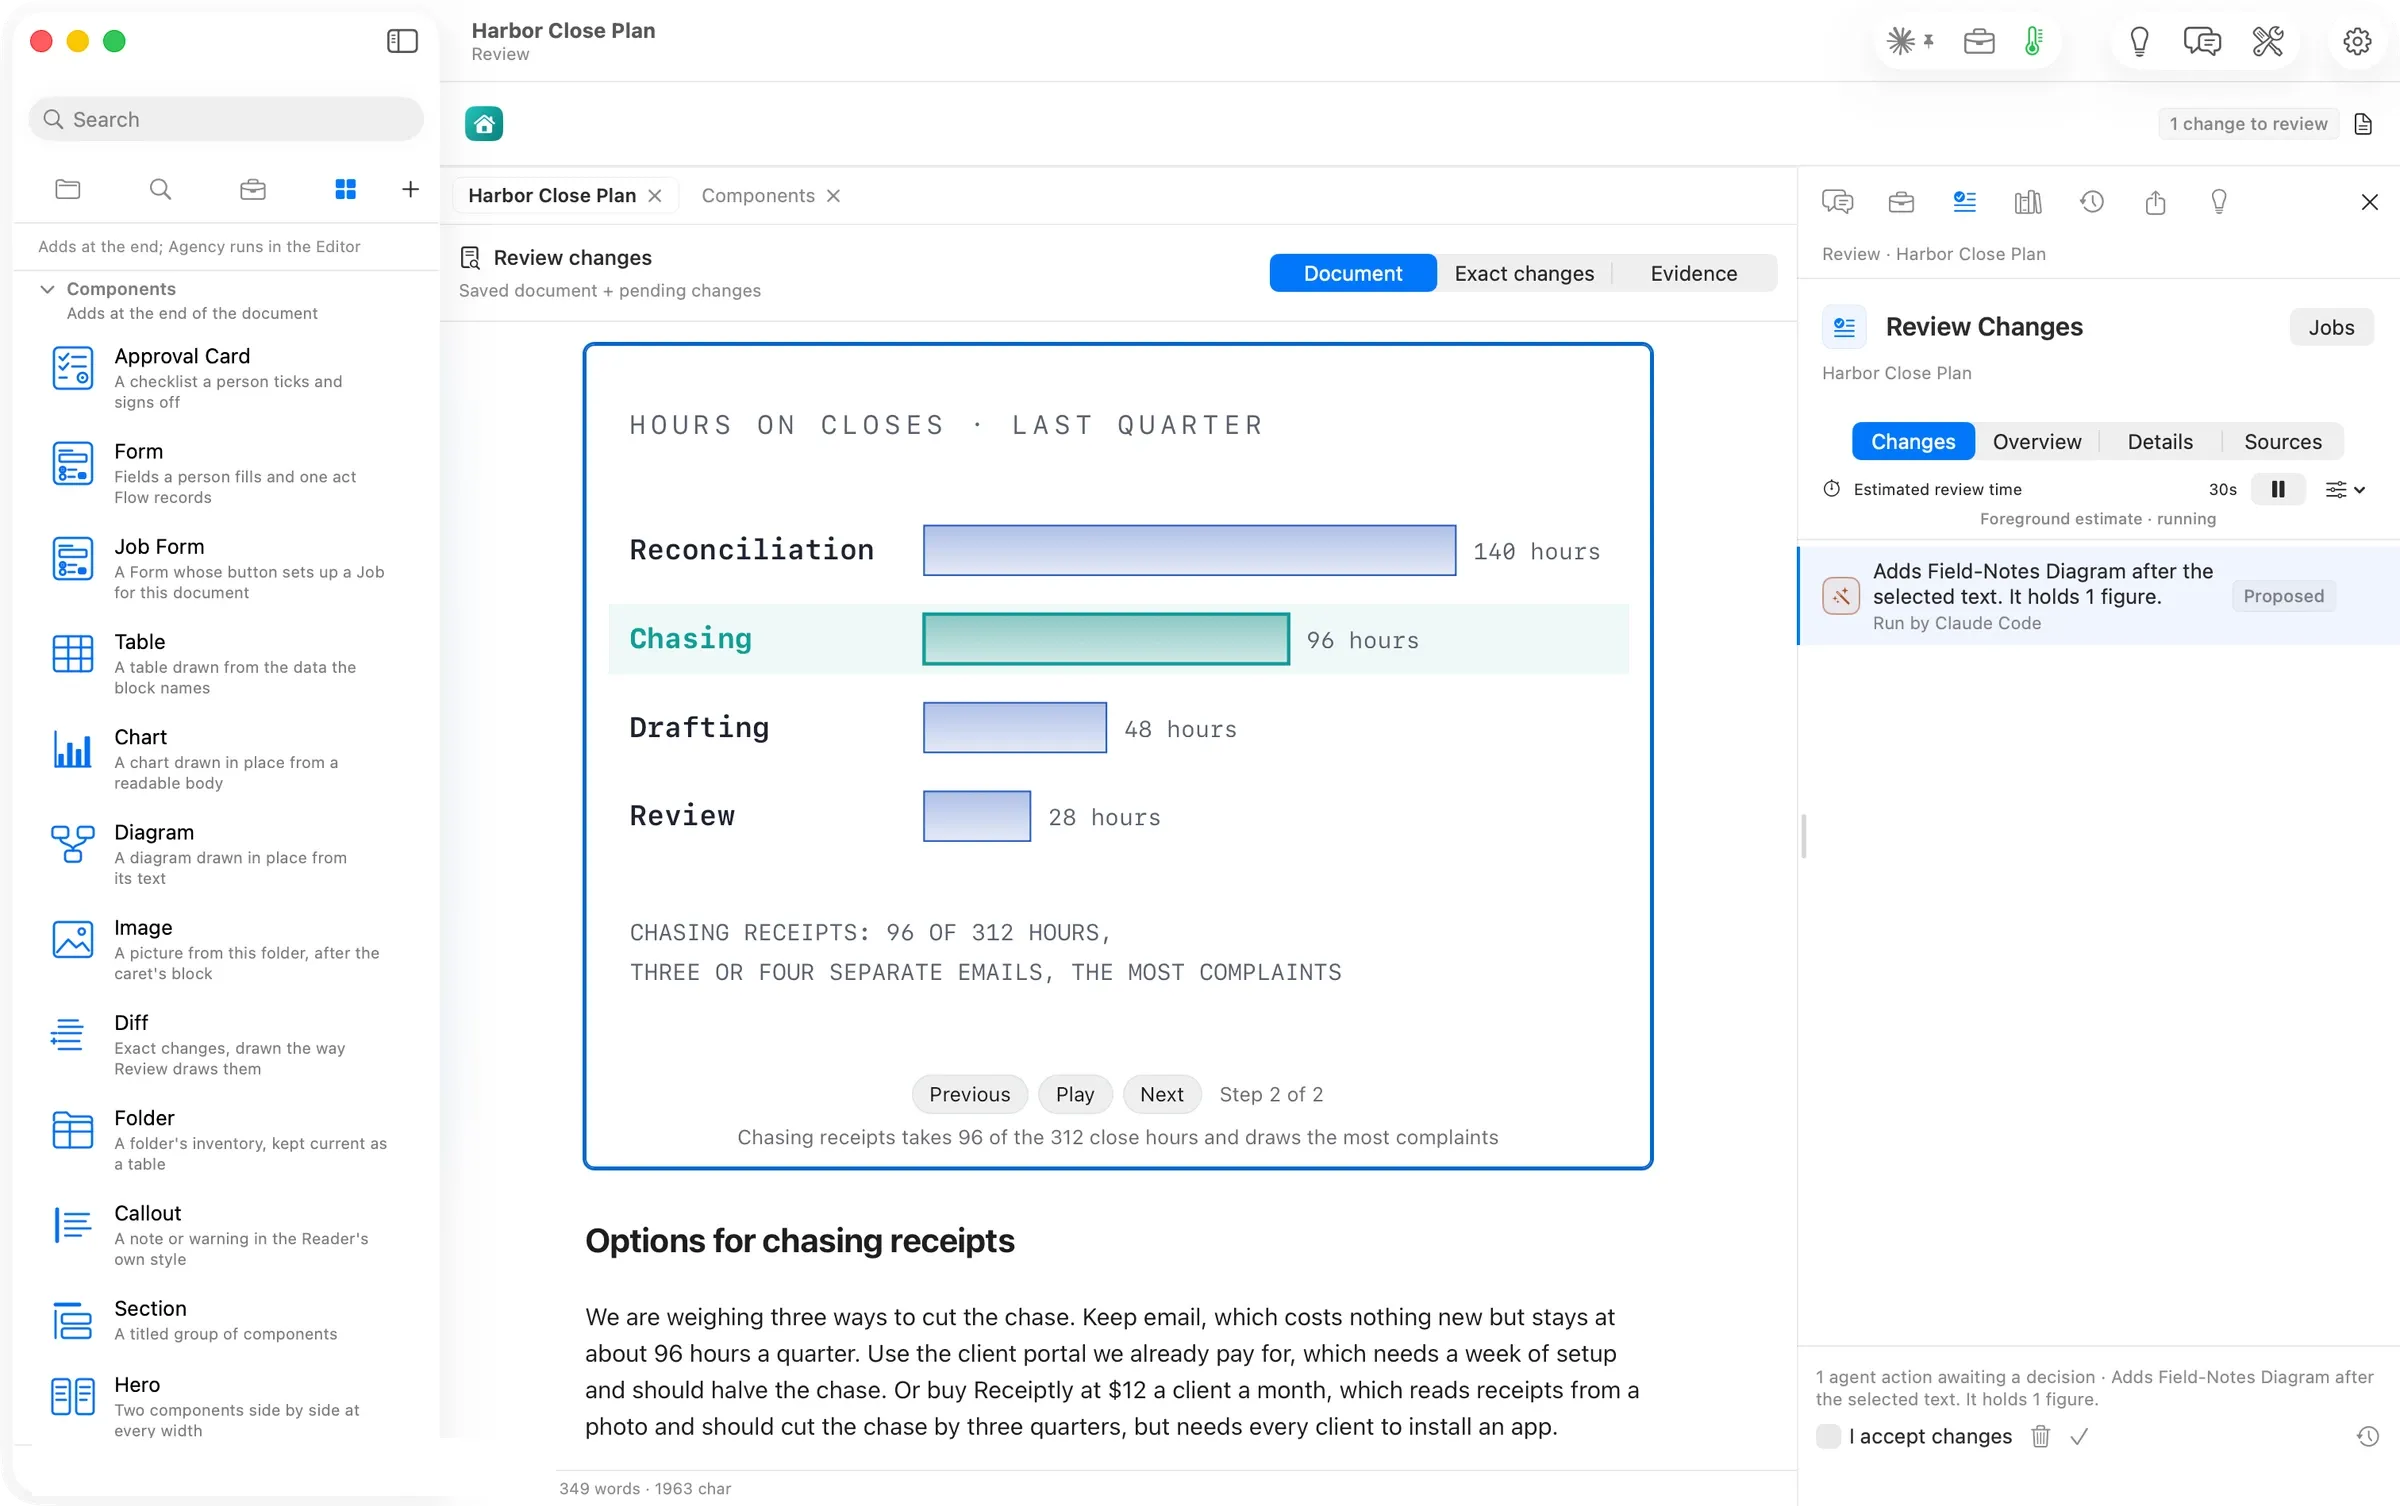
The figure arrived in Review Changes about 50 seconds later, after the section it read. Each bar is its number drawn to scale, and the number the passage stresses is the one in colour.
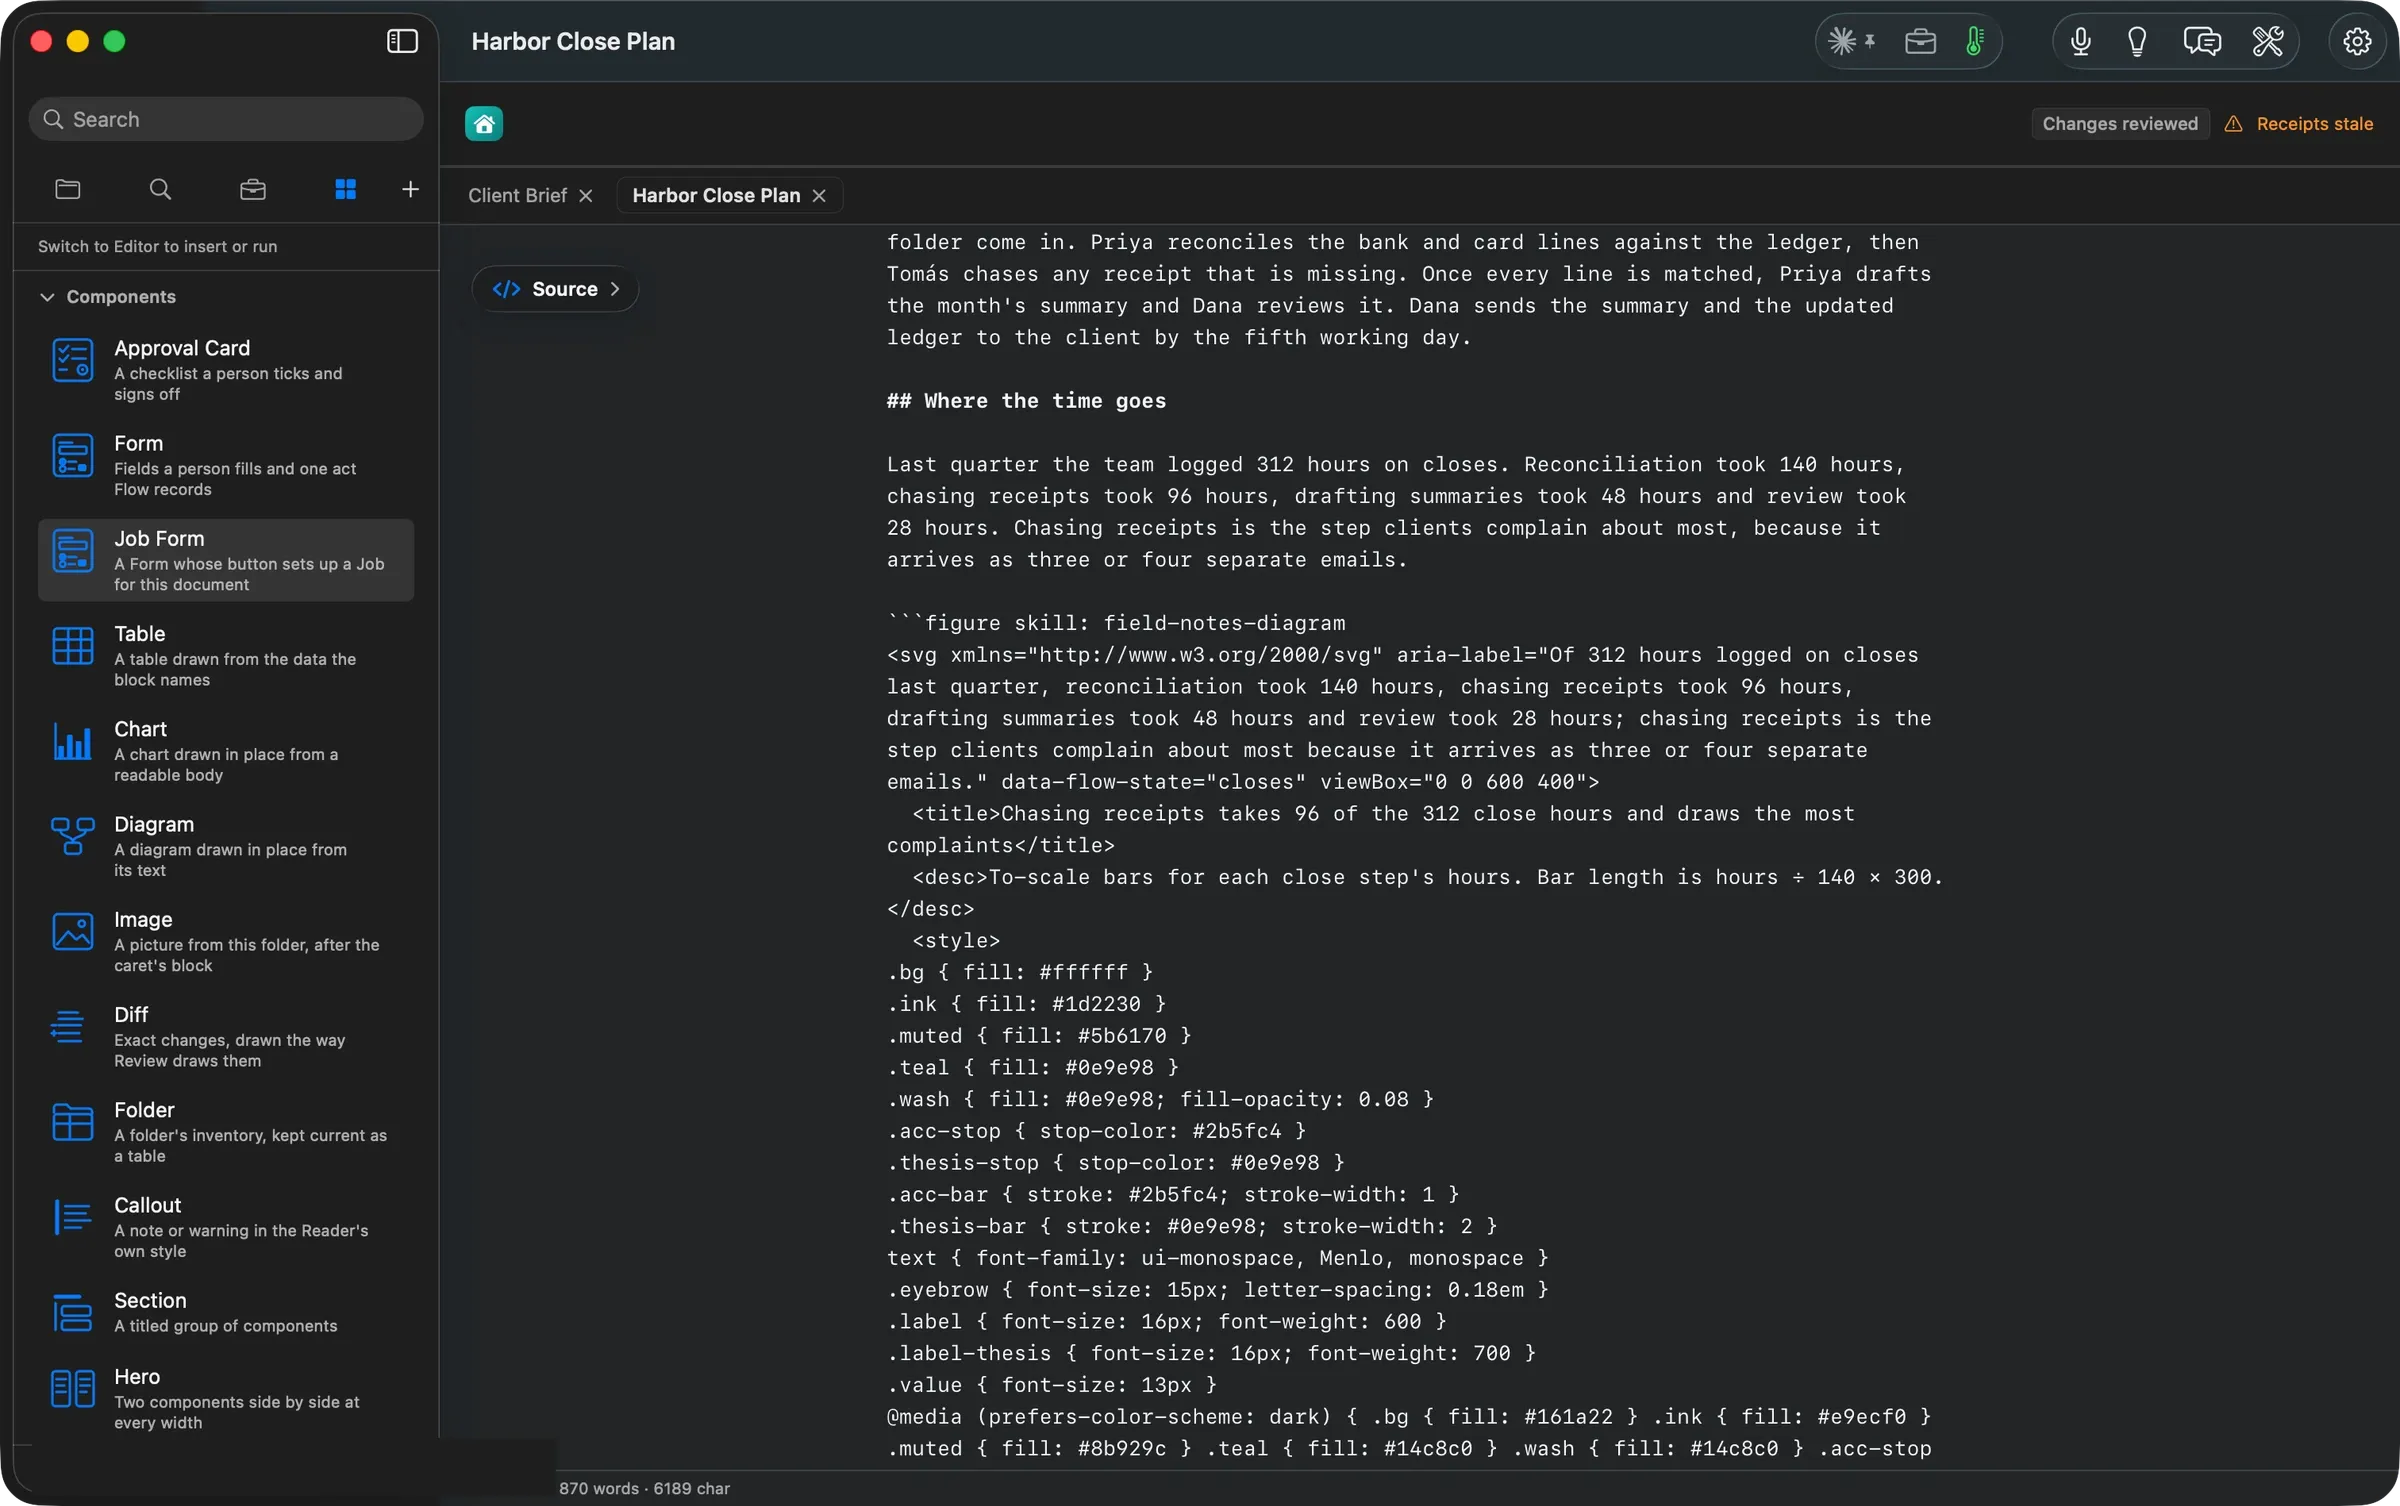
Kept, the figure is a block of text in the Markdown file. It is a figure fence holding the drawing, with its title and a description a screen reader can say. It travels with the document and redraws in dark mode.
The numbers
| Figure | Value | Status and source |
|---|---|---|
| Skills in Elements | 19 | verified: the panel’s list |
| Skills that draw a figure you step through or press | 7 (System Explainer, Visual Explainer, Isometric Figure, Field-Notes Diagram, Workflow Path, Product Mock, Path Card) | verified: each SKILL.md’s output: [figure] |
| Field-Notes Diagram, idea press to Review | about 50 s | verified: clock 13:59:13 to 14:00:03 |
| Numbers the sheet found in the section | 5 | verified: the sheet |
| Bars drawn to scale | widths = hours ÷ 140 × 300 | verified: the saved figure’s text |
| Cost of the live run | $0 extra, on the Claude subscription | verified: the sheet’s cost and route lines |
| Gallery passages and drawings | 19, one per skill | verified: the Skills Gallery pages, shot 14:11–14:14 |
| Machine | MacBook Pro M3 Max, 36 GB, macOS 26.6 | verified |
Walked on: Orionfold Flow review build elements-1 (dev, main d43eb7f2), macOS 26.6, MacBook Pro M3 Max 36 GB, window 1512×949; walked 2026-10-26 13:57–14:29 PDT by the agent in an away session, one Flow instance; the live run on Claude Code with the Claude subscription.
Data: Harbor Close Plan, a fictional plan written for this walk, and the Flow Guide's Skills Gallery, whose passages and numbers are fictional teaching examples. The account row is painted over in every full-window shot.
Written by the Flow product team from the walk's own records. Numbers are labelled verified, derived, assumed or unknown.
MORE ELEMENTS
Another group,
walked the same way.
Elements: everything a document can take, one card at a time
Every block, action, skill and chart kind in one sidebar, and Ideas naming the skill that fits each section.
Fifteen blocks a document can hold, each written as a few plain lines
Fifteen blocks a document can hold, from a checklist a client signs to a chart beside its figures. Each stays plain text.
Twelve things Flow can do to your words, each waiting for your yes
Twelve actions on your words, from proofread, summarize and translate to tables, charts, sign-offs and forms. Each waits for your yes.
Fifty-four ways to draw your numbers, and what each one needs
Fifty-four chart and diagram kinds, each with the data it takes. Switch kinds and keep your data, on your Mac, with no model involved.